

Image Source: Unsplash
July saw new highs for the broad market indexes followed by a big fall from grace among the Magnificent Seven (MAG-7) stocks. But it looked more like a healthy rotation than a flight to safety, with a broadening into neglected market segments, as inflation and unemployment metrics engendered optimism about a dovish policy pivot from the Federal Reserve. The rotation of capital within the stock market—as opposed to capital flight out of stocks—kept overall market volatility modest. But then along came the notorious month of August. Is this an ominous sign that the AI hype will come crashing down as the economy goes into a recession? Or is this simply a 2023 redux—another “summer sales event” on stock prices—with rate cuts, accelerating earnings, and new highs ahead? Let’s explore the volatility spike, the reset on valuations, inflation trends, Fed policy, and whether this is a buying opportunity.
Summary
Up until this month, a pleasant and complacent trading climate had been in place essentially since the Federal Reserve announced in Q4 2023 its intended policy pivot, with a forecast of at least three rate cuts. But August is notorious for its volatility, largely from instability on the trading floor due to Wall Street vacations and exacerbated by algorithmic (computer-based) trading systems. In my early July post, I wrote that I expected perhaps a 10% correction this summer and added, “the technicals have become extremely overbought [with] a lot of potential downside if momentum gets a head of steam and the algo traders turn bearish.” In other words, the more extreme the divergence and euphoria, the harsher the correction.
Indeed, last Monday 8/5 saw the worst one-day selloff since the March 2020 pandemic lockdown. From its all-time high on 7/16 to the intraday low on Monday 8/5 the S&P 500 (SPY) fell -9.7%, and the Technology Select Sector SPDR (XLK) was down as much as -20% from its 7/11 high. The CBOE Volatility Index (VIX) hit a colossal 67.73 at its intraday peak (although tradable VIX futures never came close to such extremes). It was officially the VIX’s third highest reading ever, after the financial crisis in 2008 and pandemic lockdown in 2020. But were the circumstances this time around truly as dire as those two previous instances? Regardless, it illustrates the inherent risk created by such narrow leadership, extreme industry divergences, and high leverage bred from persistent complacency (including leveraged short volatility and the new zero-day expiry options).
The selloff likely was ignited by the convergence of several issues, including weakening economic data and new fears of recession, a concern that the AI hype isn’t living up to its promise quite fast enough, and a cautious Fed that many now believe is “behind the curve” and making a policy mistake by not cutting rates. (Note: I have been sounding the alarm on this for months.) But it might have been Japan at the epicenter of this financial earthquake when the Bank of Japan (BoJ) suddenly hiked its key policy rate and sounded a hawkish tone, igniting a “reverse carry trade” and rapid deleveraging. I explain this further in today’s post.
Regardless, by week’s end, it looked like a non-event as the S&P 500 and Nasdaq 100 clawed back all their losses from the Monday morning collapse. So, was that it for the summer correction? Are we all good now? I would say no. A lot of traders were burned, and it seems there is more work for bulls to do to prove a bottom was established. Although the extraordinary spike in fear and “blood in the streets” was fleeting, the quick bounce was not convincing, and the monthly charts look toppy—much like last summer. In fact, as I discuss in today’s post, the market looks a lot like last year, which suggests the weakness could potentially last into October. As DataTrek opined, “Investor confidence in the macro backdrop was way too high and it may take weeks to fully correct this imbalance.”
Stock prices are always forward-looking and speculative with respect to expectations of economic growth, corporate earnings, and interest rates. The FOMC held off on a rate cut at its July meeting even though inflation is receding and recessionary signals are growing, including weakening economic indicators (at home and abroad) and rising unemployment (now at 4.3%, after rising for the fourth straight month). Moreover, the Fed must consider the cost of surging debt and the impact of tight monetary policy and a strong dollar on our trading partners. On the bright side, the Fed no longer sees the labor market as a source of higher inflation. As Fed Chair Jerome Powell said, “The downside risks to the employment mandate are now real.”
The real-time, blockchain-based Truflation metric (which historically presages CPI) keeps falling and recently hit yet another 52-week low at just 1.38%; Core PCE ex-shelter is already below 2.5%; and the Fed’s preferred Core PCE metric will likely show it is below 2.5% as well. So, with inflation less a worry than warranted and with corporate earnings at risk from the economic slowdown, the Fed now finds itself having to start an easing cycle with the urgency of staving off recession rather than a more comfortable “normalization” objective within a sound economy. As Chicago Fed president Austan Goolsbee said, “You only want to stay this restrictive for as long as you have to, and this doesn’t look like an overheating economy to me.”
The Fed will be the last major central bank in the West to launch an easing cycle. I have been on record for months that the Fed is behind the curve, as collapsing market yields have signaled (with the 10-year Treasury note yield falling over 80 bp from its 5/29 high before bouncing). It had all the justification it needed for a 25-bp rate cut at the July FOMC meeting, and I think passing on it was a missed opportunity to calm global markets, weaken the dollar, avert a global currency crisis, and relieve some of the burden on highly indebted federal government, consumers, businesses, and the global economy. Indeed, I believe Fed inaction forced the BoJ rate hike and the sudden surge in US recession fears, leading to last week’s extreme stock market weakness (and global contagion).
In my view, a terminal fed funds “neutral” rate of 3.0-3.5% (roughly 200 bps below the current “effective” rate of 5.33%) seems appropriate. Fortunately, today’s lofty rate means the Fed has plenty of potential rate cuts in its holster to support the economy while still remaining relatively restrictive in its inflation fight. And as long as the trend in global liquidity is upward, then the risk of a major market crash this year is low, in my view. Even though the Fed has kept rates “higher for longer” throughout this waiting game on inflation, it has also maintained liquidity in the financial system, which of course is the lifeblood of economic growth and risk assets. Witness that, although corporate credit spreads surged during the selloff and market turmoil (especially high yield spreads), they stayed well below historical levels and fell back quickly by the end of the week.
So, I believe this selloff, even if further downside is likely, should be considered a welcome buying opportunity for long-term investors, especially for those who thought they had missed the boat on stocks this year. This assumes that the proverbial “Fed Put” is indeed back in play, i.e., a willingness to intervene to support markets (like a protective put option) through asset purchases to reduce interest rates and inject liquidity (aka quantitative easing). The Fed Put also serves to reduce the term premium on bonds as investors are more willing to hold longer-duration securities.
Longer term, however, is a different story, as our massive federal debt and rampant deficit spending is not only unsustainable but potentially catastrophic for the global economy. The process of digging out of this enormous hole will require sustained, solid, organic economic growth (supported by lower tax rates), modest inflation (to devalue the debt without crippling consumers), and smaller government (restraint on government spending and “red tape”), in my view, as I discuss in today’s post.
In buying the dip, the popular Big Tech stocks got creamed. However, this served to bring down their valuations somewhat, their capital expenditures and earnings growth remains robust, and hedge funds are generally underweight Tech, so this “revaluation” could bode well for a broader group of Tech stocks for the balance of the year. Rather than rushing back into the MAG-7, I would suggest targeting high-quality, fundamentally strong stocks across all market caps that display consistent, reliable, and accelerating sales and earnings growth, positive revisions to Wall Street analysts’ consensus estimates, rising profit margins and free cash flow, solid earnings quality, and low debt burden. These are the factors Sabrient employs in selecting our growth-oriented Baker’s Dozen, value-oriented Forward Looking Value (which just launched on 7/31), growth & income-oriented Dividend portfolio, and the Small Cap Growth (an alpha-seeking alternative to a passive position in the Russell 2000).
We also use many of those factors in our SectorCast ETF ranking model. And notably, our Earnings Quality Rank (EQR) is a key factor in each of these models, and it is also licensed to the actively managed, absolute-return-oriented First Trust Long-Short ETF (FTLS) as an initial screen.
Each of our alpha factors and their usage within Sabrient’s Growth, Value, Dividend income, and Small Cap investing strategies is discussed in detail in Sabrient founder David Brown’s new book, How to Build High Performance Stock Portfolios, which will be published this month (I will send out a notification).
Market commentary
Despite an historically tumultuous political scene, the stock market displayed impressive strength all year, reaching all-time highs in mid-July, driven almost entirely by AI euphoria and a capex boom, with narrow leadership from mega-cap Tech, semiconductors, and the “AI Tech Stack” companies that have been essentially wholly responsible for S&P 500 earnings growth over the past 6 quarters. This market action suggested little concern about the hawkish Fed, with its “higher for longer” rates and stagnant M2 money supply growth—but the lagging performance in value, dividend, and small-mid stocks betrayed otherwise. This is why I have been anticipating a Q3 correction of greater magnitude than April’s, followed by a market rotation, broadening, and mean reversion into those lagging market segments with support from the proverbial the Fed Put and dovish forward guidance.
When it was evident that the FOMC was not quite ready to cut rates and weaken the dollar, the Bank of Japan apparently felt it had no choice but to support its currency and economy, so it expressed a hawkish tone while lifting its policy interest rate (albeit only 15 bps, from 0.10%—or essentially zero—to 0.25%) to support the yen. Moreover, with the yen suddenly surging against the dollar (after teetering on the verge of collapse), the longstanding, crowded, easy money, highly leveraged “yen carry trade” was set up to unwind into a “reverse carry trade.”
The yen carry trade entailed hedge funds (as well as many institutional and individual investors) borrowing yen at ultra-low interest rates, converting to dollars or other currencies (thus effectively shorting the yen and driving down its exchange rate), and then buying much higher-yielding bonds and all manner of risk assets—largely in the US, including the popular MAG-7 stocks, but also Japanese stocks. As traders had to hurriedly cover their short yen positions by selling their leveraged holdings, not only did the US markets gap down on Monday morning but the Nikkei stock market index collapsed by the most since 1987.
Looking ahead, the question is whether the reverse carry trade will continue to fully unwind—particularly if the BoJ keeps raising rates and the yen keeps strengthening, which could happen if inflation continues to rise in Japan. And if it does unwind further, how much money are we talking about? It’s unclear, but estimates range anywhere from $1 trillion to a whopping $20 trillion (i.e., roughly 500% of Japan’s GDP), according to The Kobeissi Letter. In any case, a complete unwind would be no small thing for global markets.
From November 2023 until last Monday’s selloff, the VIX had only briefly eclipsed the “fear threshold” of 20. So, complacency reigned, and the surge in volatility upset the apple cart in a big way. According to Bespoke Investment Group, “the S&P 500 finally hit extreme oversold territory by moving more than two standard deviations below its 50-day moving average.” Virtually no risk asset escaped unscathed as capital moved to cash or to deleverage. Stocks, oil, gold, crypto, and the US dollar all pulled back, as normally uncorrelated assets must be sold to cover losses on leveraged positions. But US Treasuries quite noticeably resumed their traditional role as a global safe haven. And although SPY and QQQ have recovered back to where they closed the previous week, investor confidence was shaken, and the VIX closed the week above 20. But that’s not necessarily a bad thing as it helps keep speculation and malinvestment somewhat in check.
I believe the writing has been on the wall for some time, with federal deficit spending temporarily propping up the economy and jobs growth (and keeping inflation “sticky,” as I discuss later), leaving us today with private sector lethargy (outside of AI projects and spending) and a lack of organic growth. Capital, labor, and productivity are the key inputs to economic growth. So, perhaps massive capital expenditures will lead to historic technological breakthroughs and radical productivity enhancements from artificial intelligence that remakes our lives, economy, and workplace, much like prior gamechangers like the printing press, steam engine, electrical grid, telephone, automobile, personal computer, semiconductors, cellular network, and Internet. Some believe AI will be even more transformational than any of them.
Valuations:
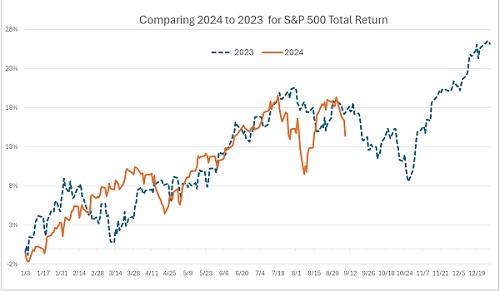
As I observed last month, the 2024 stock market is looking a lot like 2023. While 2023 began on the heels of the 2022 bear market, 2024 commenced amid the AI-driven, Tech-led optimism (which really began to accelerate in Q3 2023) and the promise of immense productivity growth, rising earnings, falling inflation, and a supportive Fed. So, while the macro climate was quite different entering this year, the S&P 500 is tracking quite similarly to 2023, as shown in the chart below. For 2024, the H1 correction came 2 months later than in 2023, and the Q3 correction started just a couple of weeks sooner. Might it continue to mirror 2023 going forward? And if so, is there more downside (and better prices) yet to come, with the ultimate buying opportunity arriving in October?
After displaying extreme positive performance and valuation divergences, July saw the market begin to rotate and broaden into the lagging segments. Long-invincible growth was suddenly crushed by value (although growth is still well ahead YTD). Moreover, while growth-oriented sectors Communication Services (XLC) and Technology (XLK) fell dramatically, defensive/value sectors like Consumer Staples (XLP), Real Estate (XLRE), and Utilities (XLU) have held up much better over the past month. After all, for quite a while, Big Tech has served as a safe, “defensive” play given wide “moats,” impenetrable brand loyalty, huge cash balances, and massive capex budgets providing a huge advantage in innovation. But then Big Tech got a little too much “bid for its britches,” if you’ll pardon the play on words.
When the imminence of Fed rate cuts was in doubt, capital kept flowing into the cash-flush mega-cap Tech titans, pushing up their valuation multiples. But when the economic data soured, rate cuts came back on the table, and the capital-intensive and interest-rate-sensitive value and small-cap stocks were suddenly attractive given their much lower valuation multiples. For example, the forward P/E on the Nasdaq 100 (QQQ) at 25.2x and a P/E-to-Growth ratio (PEG) of 1.51, and S&P 500 (SPY) at 21.0x and 1.55, but looking beyond cap-weighted, broad market indexes we find much more palatable valuations, with the equal-weight S&P 500 (RSP) at a forward P/E of 16.4x and a PEG of 1.58, as of 8/9. And as for the small cap indexes, the quality-oriented S&P 600 SmallCap (SPSM) is at only 14.5x and 1.39, and the Russell 2000 (IWM) is at 15.2x and 1.15. The lower the forward P/E and PEG, the better, so small caps appear to be undervalued.
During the small cap surge in July, small cap funds saw the second largest weekly inflow ever, helping drive up the Russell 2000 Index by +11.5% over a 5-day stretch. In fact, relative to the S&P 500 Index, it was the Russell 2000’s largest rolling 5-day outperformance over the S&P 500 in history (10 pps). But of course, the cumulative relative performance divergence of large over small caps had never been so extreme, so it might be simply some overdue “mean reversion.” Nevertheless, DataTrek has observed that sharp/sudden moves in which small-caps have outperformed large-caps by such a wide margin have historically coincided with market bottoms, not the beginning of new bear markets. And according to prominent analyst Ryan Detrick of the Carson Group, in the 10 prior times the Russell 2000 gained at least 10% in 5 days, it was higher a year later 8 times and up an average of +25.4%.
But it can’t be ignored that, although small caps are inherently riskier and carry a higher beta, and although exhaustive academic studies by Fama and French have shown that small caps reward investors for the higher risk by outperforming over time, they haven’t provided sustained outperformance in many moons. Indeed, mega-cap Tech dominance has been evident since the FAANG acronym was coined around 2014. Lower-quality high-yield bonds have been rewarding investors, but lower-quality small cap equities have not. Richard Bernstein Advisors put out a piece recently that said, “Historically, large cap stocks (higher quality) tend to outperform smaller cap stocks (lower quality) when high yield credit spreads are widening (high quality bonds outperform low quality bonds)... However, the relationship has reversed since the end of 2022. Large cap stocks have outperformed smaller stocks despite credit spreads narrowing. This is quite rare and conflicts with sound economic theory… Something has to give… We continue to believe that economic precedent will hold. Profits are accelerating and credit conditions remain healthy.” So, RBA foresees “a more favorable outlook for small cap stocks over high yield bonds and large cap stocks.”
On the other hand, some commentators say the rally in small caps is unsustainable because it is not supported by fundamentals. Indeed, the percentage of companies in the Russell 2000 small-cap index that are unprofitable (negative trailing 12-month EPS) has risen from 15% in the 1990’s to 41% today. Moreover, they have high debt loads and thus rely on new debt issuance to stay solvent (euphemistically called “zombie” companies). But when you look at the subset of fundamentally sound small caps, they comprise an undervalued asset class.
So, a better investment approach for investors might be the quality-oriented S&P 600 index (which requires a history of consistent profitability for eligibility in the index) or preferably an active selection approach that identifies high-quality companies with the best fundamentals and growth prospects—which is what Sabrient seeks to do with our Small Cap Growth portfolio. Furthermore, our new Scorecard for Stocks (soon to launch as a research subscription) provides the Top 30 stocks on a weekly basis for each of 4 investing strategies, including a rules-based version of Sabrient founder David Brown’s Small Cap Investing strategy, as described in his new investing book—which will be published on Amazon.com later this month.
Regarding the still-lofty valuations on the major cap-weighted indexes even after the selloff, I believe they can be largely justified for several reasons, including still-solid earnings growth, a high ratio of corporate profits to GDP, rising liquidity, falling interest rates (particularly if and when the discount rate gets closer my 3.0-3.5% “neutral” target), massive corporate capex, and the promise of continued margin growth across all industries due to tremendous improvements in productivity, efficiency, and product development speed from Generative AI, Large Language Models (LLMs), Big Data…and perhaps the “Holy Grail” of Artificial General Intelligence (AGI) for complex problem solving and Intelligence-as-a-Service (IaaS). In fact, wealth manager Bernstein forecasts Big Tech spending will exceed $200 billion this year and surpass $1 trillion over the next few years.
On a cautionary note, according to Fox Business, Warren Buffett’s Berkshire Hathaway (BRK-B) has moved to a record level of cash ($277 billion)—largely by selling half its holdings in Apple (AAPL)—and now owns more short-term T-bills ($235 billion) than the Federal Reserve. Furthermore, divergences between optimistic earnings expectations and falling consumer confidence (like we have today) has historically resolved in falling earnings. So, to hedge against this outcome, it seems wise to diversify across uncorrelated asset classes (including often-neglected market segments) like value, energy, and materials stocks, real assets (real estate, precious metals, commodities—including the miners and royalty/streaming companies), TIPS, IG bonds, solid dividend payers, preferred shares, and crypto.
Rate cuts are also generally beneficial for gold by lowering the opportunity cost of holding a non-yielding asset like gold while potentially devaluing the dollar in the currency market, making it more attractive as a store of value. Regardless, gold has been notably strong this year despite elevated interest rates, a strong dollar, and low volatility, which are usually impediments to investor interest. This suggests a market expectation of global monetary easing (i.e., lower rates and liquidity support), a weaker dollar, central bank buying, continued government and consumer demand (led by China and India), and global uncertainty around economic growth, turbulent elections, multiple wars, and escalating geopolitical tensions.
Economy, inflation, and Fed policy:
Q2 real GDP growth came in at an annualized rate of 2.8%, which beat expectations and seems respectable. However, Vance Ginn, the former chief economist of the White House's Office of Management and Budget tweeted, “When you correctly subtract volatile inventory investment and redistributionary, unproductive government spending, the productive private sector growth was just 1.3%.... It's good that GDP inflation moderated to 2.3%, but disposable personal income increased by just 1%, and the savings rate declined to a fresh low of 3.5%.... Bottom line: The American economy continues to fluctuate greatly because of bad fiscal and monetary policies that contribute to poor outcomes for many Americans.” Looking ahead, the Atlanta Fed GDPNow model forecasts Q3 real GDP growth to be 2.9%.
However, the quarterly Gross Output (GO) metric, which measures the full scope of commerce throughout the supply chain (not just final consumer demand), has been growing slower than GDP at only 1.4% annualized, which historically suggests an imminent slowing in GDP and perhaps a recession. Economist Mark Skousen has long asserted that business spending rather than consumer spending is the real engine of economic growth by creating jobs and raising wages, and the BEA got onboard and began to publish GO. Indeed, with B2B spending growth having recently turned negative, this is more evidence that only government deficit spending has kept GDP and jobs growth positive, rather than organic growth in the private sector.
M2 money supply in June registered $21.02 trillion, which is down -1.0% YoY and -3.2% below its April 2022 high of $21.72 trillion. So, the Fed is keeping rates “higher for longer” and allowing money supply to trend down. However, velocity of money supply (M2V) has risen over the past couple of years (after many years of decline and ultimately falling off a cliff during the pandemic lockdown) and continues to offset the stagnant money supply—although it might begin to fall again as rising debt at high interest rates forces an increasing amount of capital to go towards funding rising and non-productive government spending and debt service. Furthermore, manufacturing activity remains weak, services activity has become tenuous, home sales are bad, and bank credit conditions remain tight. Furthermore, although personal income is still rising, wage growth is slowing, consumer spending has been weakening, and consumer loan and credit card delinquencies have been rising.
Federal debt has now eclipsed $35 trillion, which equates to approximately $105k per US citizen, $266k per household, and $484k per child (according to StickyTrades.com). And it’s rising fast at a rate of about 7% of GDP per year, which is faster than the nominal GDP growth rate and 3 times faster than real GDP growth. As a result, the US debt/GDP ratio has passed 120%, which equates to levels last seen during World War II, and the cost of serving that debt exceeds $1.1 trillion/year, which of course hinders economic growth by redirecting valuable capital into unproductive uses.
According to economist Mark Skousen, “…the Fed needs to adopt Milton Friedman’s Monetarist Rule: Increase the money supply at a stable rate close to the long-term economic growth rate of 3-4% a year. Unfortunately, the Fed is moving in the opposite direction of an unstable ‘easy money/tight money’ policy, what I call the Fed Disaster Plan. The longer the money supply remains stagnant, the more likely we will see a recession…. In short, the Fed is perpetuating the boom-bust cycle….It was the ‘easy money’ policies of the 2020-21 period that caused the return of inflation, and now it’s the Fed’s ‘tight money’ policy that is bringing inflation back down. But it could also cause a deep recession if it continues.”
Heading into the July FOMC meeting last week, former New York Fed President Bill Dudley suddenly reversed his view and called for an immediate rate cut. In his Bloomberg article titled “I Changed My Mind. The Fed Needs to Cut Rates Now,” he wrote: “I’ve long been in the ‘higher for longer’ camp… The facts have changed, so I’ve changed my mind. The Fed should cut, preferably at next week’s policy-making meeting… Although it might already be too late to fend off a recession by cutting rates, dawdling now unnecessarily increases the risk.” Similarly, Chicago Fed President Austan Goolsbee believes current rates are overly restrictive in the face of pressures on employee, wage growth, rising consumer debt and delinquencies, and falling inflation.
Again, in my view, the writing has been on the wall in that only government deficit spending has been temporarily propping up the economy and jobs growth. But now that “investment” (as government likes to call it euphemistically when they are simply buying jobs and production—and votes) is petering out and leaving us with the same private sector sluggishness and lack of true, organic growth.
But what about those “sticky” inflationary pressures, you ask? Let’s look at the reality of that.
The upper chart below compares the trends since June 2021 in CPI, Core CPI, and Core PCE. It shows that PPI cratered to nearly zero in June 2023 but has been chopping around on a gradual upward path since then. Similarly, headline CPI has gone essentially sideways since June 2023. However, Core CPI and Core PCE (excluding the volatile food & energy components) have maintained a consistent downward trend from their September 2022 highs, coming in at +3.28% and +2.63%, respectively, in June 2024. Furthermore, I also like to examine current inflation trends by computing a rolling 3-month annualized average of MoM readings, as shown in the lower chart. 3-month Core PCE fell to +2.31% in June from +2.93% in May, and 3-month Core CPI fell to +2.10% in June from +3.30% in May.
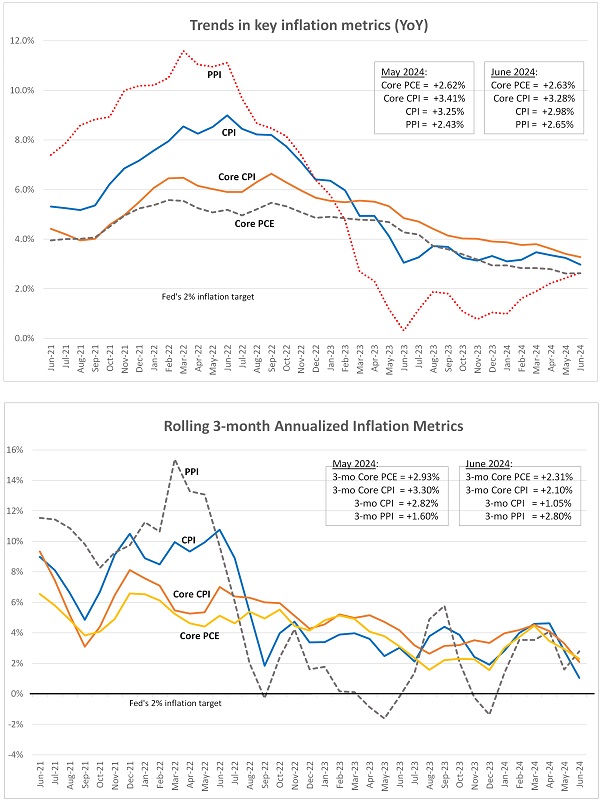
And, as I mentioned earlier, the real-time, blockchain-based “Truflation” metric—which is published daily and historically presages CPI by several months—keeps falling, recently hitting yet another 52-week low of just 1.38%. Also, given that Core PCE ex-shelter is already below 2.5%, I expect Core PCE will also show it fell below 2.5% for July. Disinflation continues, and the lag in shelter costs is starting to show up.
As for the weak jobs report on Friday 8/2, it was notable to me that civilian employment (an alternative measure of jobs that includes small-business start-ups) was up only 57,000 from a year ago, and the household survey showed full-time employment down by 500,000 versus a year ago and part-time employment higher by 550,000, which is not a favorable tradeoff. Furthermore, the labor force increased by 420,000. So, given the combination of weak jobs growth and a fast-growing labor force, the jobless rate for July rose to 4.3%—which is well above the 4.0% threshold for Fed concern.
Inflation erodes purchasing power. Of course, massive deficit spending is inherently inflationary—and it’s especially galling when it is spent on pet projects, earmarks, boondoggles, student debt forgiveness, and other zero-return items (to “buy votes”). I wrote at length in my June post about the inefficacy, destructiveness, and economic death spiral of unfettered deficit spending. Without serious change, codified automatic spending increases will consume ever more of the tax revenue, drive up debt, and lead to a state of “fiscal dominance” in which the Fed has no choice with monetary policy but to “feed the beast” rather than control inflation. As MacroStrategy Partnership has opined, “More government, especially when deficit-funded, doesn’t solve problems, it is the problem… The empirical evidence is clear, chronic deficits severely erode economic growth.”
Of course, war is inherently inflationary, and no one (except of course the defense industry) benefits from the resulting death, destruction, and wide-ranging, long-term repercussions. Moreover, war is mostly financed through deficit spending, and as it escalates or spreads, it can disrupt supply chains and create outsized demand for scarce resources leading to supply shortages, as well as induce moments of panic in the capital markets.
Nevertheless, despite the recent escalation in the Middle East war, I expect inflation will continue to recede as supply chain pressures and energy prices are subdued, the fiscal impulse from the big spending bills wanes, money supply growth is stagnant, wage growth falls, and lag effects of tight Fed policy dampen commerce. Various services prices that had a big reset in Q1 (like insurance premiums!) and the big lag in shelter cost are the main inflation drivers, but real-time rents are falling. Also, the surge in copper—an important industrial bellwether—has reversed, falling over 20% from its 5/21 high and giving up almost all its 2024 gains, as demand has fallen and inventories have risen.
So, the cut in September (or mid-term, if necessary) might need to be 50 bps, particularly if inflation metrics fall meaningfully. Indeed, the collapse in market Treasury yields following the FOMC rate decision on 7/31 indicates that “the market” is signaling that the Fed has made a policy mistake, with the 10-year Treasury note yield falling over 80 bp since its 5/29 high. However, a surprise 50-bp (or even 75-bp) cut is unlikely due to the shock it would cause to the global financial system (e.g., leveraged carry trades)—which is why starting with 25 bps in July would have been prudent. On the bright side, the weakening housing market should stabilize and improve as the drop in the 10-year yield feeds through to mortgage rates.
This week will see July PPI and CPI reports, and then July PCE will come out on 8/30, followed by the August jobs report on 9/6. I expect the Fed should soon have all the data it needs to justify a 25-50-bp rate cut on (or before) its next FOMC meeting on 9/18.
Final comments:
July was a crazy month in our political scene. There were two attempts to thwart democracy—one unsuccessful and the other successful. First, there was an assassination attempt on former president and GOP nominee Trump. Then, first-term President Biden was coerced by his party to drop out of his reelection campaign after having already won all the state primaries and bestow all his delegates upon a replacement candidate who was anointed at the behest of party elders without having to endure a competitive primary campaign or win a single popular vote or delegate on her own. Even worse, this strongarming was done mainly because polls showed he would likely lose. And don’t forget that the party had previously intimidated anyone from challenging Biden in the Democrat primaries, forcing the lone rival RJK Jr. to drop out last October (although he has soldiered on as an Independent). So much for the democratic process. And our valiant and vigilant “watchdog” mainstream media seems to have no problem with any of it.
As for the two parties’ platforms, although Harris hasn’t yet articulated a policy platform as I write this, here are my general policy expectations for each side, based on either their words or deeds:
First, it seems the Democrat Party has now fully and openly embraced a globalist / quasi-socialist / redistributionist / secularist / heavy-regulation / Big-Government agenda to remake America as part of a New World Order (e.g., “What can be, unburdened by what has been”)—often requiring broad sacrifice from the public—with priorities like fighting climate change through decarbonization, “compassionate immigration” and sanctuary policies, DEI, social justice, decriminalization, “rebuilding” the middle class, universal basic income, equalizing economic outcomes and living standards (typically to the lowest common denominator) in the name of equity, “progressive internationalism” and shared global leadership, and defending oppressed peoples and cultures around the world from Western capitalist imperialism and exploitation. Also, it seems their agenda seeks to “modernize” our Bill of Rights by curtailing 7 of the 10 articles of our Bill of Rights—including free speech (#1), gun ownership (#2), unreasonable search & seizure (#4), due process (#5), trial by impartial jury (#6), excessive fines (#8), and states holding powers not specifically delegated to the federal government (#10).
On the other hand, it seems the GOP is pursuing an America-first / constitutionalist / capitalist / populist / deregulated / reduced-government agenda that seeks to restore and uphold core Western moral values, American exceptionalism, individual liberties, meritocracy, equal opportunity, the rule of law, and strict border security and controlled immigration; create a vibrant economy that lifts living standards of all US citizens and permanent residents; address wealth inequality by tackling root causes (rather than token after-the-fact adjustments) while accepting that unequal outcomes are inevitable in a vibrant capitalist meritocracy; and employ a foreign policy of leadership, creative diplomacy, “fair trade,” economic nationalism, peace through strength, and mutual respect. Also, it seems their agenda seeks to uphold the Constitution and Bill of Rights as written by installing constitutional conservatives as judges and justices and discouraging courts from “legislating from the bench” and end-running the legislative process.
This is not to say each side is able or willing to follow through on these visions, but the differences are stark. However, what the two sides have in common is that neither has shown the stomach or backbone to be honest with the electorate about the need to aggressively address our dire $1.9 trillion budget deficit and $35 trillion federal debt, much less the gargantuan total unfunded liabilities—comprising the federal debt as well as guaranteed programs like Social Security, Medicare, employee pensions, and veterans’ benefits—which are estimated to be at least $212 trillion and growing fast. And that doesn’t address municipal pension liabilities, failing banks, and state budget deficits that might eventually need federal bailouts.
Why won’t either side confront this spending addiction? Well, it’s because we, the electorate, don’t want them to—and we have demonstrated time and again we won’t vote for anyone who threatens to confront it. I wonder if Argentina’s Javier Milei and his “wrecking ball policies” can be loaned to us for a few years?
By the way, as governments at all levels—both at home and abroad—increasingly seek to control all human activity and speech, we can see how such interventionism always distorts healthy free markets. This dynamic accelerated in the wake of the pandemic, but it had been in motion for a long time. Often it is because most government leaders globally have little faith or belief in free markets—and in a vicious cycle, the more distorted the markets become, the less faith the electorate has in them and the more we elect and encourage the same kinds of weak leaders—until such time that the economic degradation, malinvestment, and ill-functioning markets become so destructive that the electorate finally gets sufficiently fed up and desperate, leading to a backlash like they had in El Salvador and Argentina…and perhaps soon in Venezuela as well.
As financial writer and entrepreneur Bill Bonner wrote, “Over time, freedom gives way to politics. A dynamic, entrepreneurial economy is taken over by central planners and hacks. And small government yields to Big Government, with its millions of rules regulation, lawyers… prisons… fines… missiles… sanctions… 2% target inflation… malinvestment and claptrap. How much these things slowed down the economy is incalculable.”
Just once before I die, rather than the newly elected administration announcing all their new executive orders, legislative proposals, oversight departments, tax and regulatory expansions, and myriad other ways they intend to control my life, I wish they would simply say, “We’re slashing taxes and regulations, rescinding previous executive orders, restoring your freedoms, and putting your money back in your pocket. We will focus simply on protecting your life, liberty, property, border security, national defense, interstate commerce, and Bill of Rights; maintain public works and infrastructure; handle international relations on your behalf; and ensure a basic social safety net in your retirement or infirmity. The rest is up to you.” One can dream.
As for the stock market, it seems the direction of small caps and value stocks has waxed and waned along with the political polls and election odds. Bespoke Investment Group observed a strong correlation over the past several months between the betting odds of a Trump win (from electionbettingodds.com) and the S&P 500, which implies a perceived benefit to economic growth, earnings, and stock prices if Trump wins. Indeed, his policies might be more favorable—especially for domestically focused small caps—regarding lower corporate taxes and looser regulations (“red tape”), which historically leads to more robust commerce and competition, greater economic efficiency, stronger GDP growth, better profit margins and earnings, and disinflation.
However, it must be accompanied by restraints on government spending bills and boondoggles. This way, rather than relying on big government spending on favored sectors (i.e., top-down picking of winners and losers, like a politburo), the free market can decide what merits investment for the greatest returns and benefits. If high returns on capital spending are expected, that means there are lots of willing buyers eagerly awaiting the production that comes from that spending—unlike today’s government subsidies of, for example, electric vehicles, which have only tepid demand (gasoline-powered and hybrids are much preferred by consumers).
But it really depends not just on the president but also on the make-up of Congress and whether or not onerous tax and regulatory policies are enacted that hinder corporations, small businesses, and entrepreneurs across the board. Given looser reins, business will find a way to grow. With the betting odds of a single-party sweep (President, Senate, and House) quite low, gridlock in Congress is likely, which capital markets generally like.
Regardless, I expect higher prices by year end and into 2025 (no matter who wins the election) as the Fed brings interest rates down and global liquidity rises. Keep in mind, rate cuts are implemented not simply by decree but also by injecting liquidity into the banking system (by buying securities) to increase the money supply available to lend, including through the Fed’s open market operations (OMO). Other central banks around the world are already starting to cut rates and inject liquidity—perhaps as much as $2 trillion will hit the global economy, by some estimates—which should find its way into stocks and bonds. CrossBorder Capital reminds us that the best time for investors is when policymakers are trying to stimulate sluggish economies.
Moreover, the stimulus of rising global liquidity would be expected to increase global demand for commodities due to trends in decarbonization, emerging-market urbanization and a growing middle class, developed-market infrastructure upgrading, supply constraints, and regulatory hurdles. Thus, a commodity “Supercycle” seems like a good bet for perhaps the next 5-10 years.
Lastly, as I mentioned earlier, we at Sabrient believe that a high-quality, fundamentally strong stock is one that displays consistent, reliable, and accelerating sales and earnings growth; positive revisions to analysts’ consensus estimates; rising profit margins and free cash flow; and solid earnings quality. In addition, it should have a leading position in its industry and product category; a strong balance sheet with low debt levels; and high return ratios, e.g., return on equity (ROE) and return on capital employed (ROCE). Also, a history of dividend growth and/or share buybacks is desirable.
Sabrient Scorecards for Stocks and ETFs
As a reminder, we have created a new version of our quantitative, Excel-formatted, Sabrient Scorecards that will launch shortly. They are based on the investing strategies described in David Brown’s new book, which is soon to be published on Amazon.com. The new Scorecard for Stocks is intended to help investors and advisors with stock search, fundamental screening, idea generation, risk monitoring, and confirmation, as well as portfolio construction for four specific investing styles: 1. Growth, 2 Value, 3, Dividend Income, and 4. Small Cap investing. We also offer a Scorecard for ETFs based on the SectorCast model described below.
Both sheets will be posted weekly in Excel format and allow you to see how your stocks and ETFs rank in our system…or for identifying the top-ranked stocks and ETFs (or for weighted combinations of our alpha factors). I will be sending out a formal announcement on the launch of David’s book and the new Scorecards later this month, so be sure you are on our mailing list!
Latest Sector Rankings
Relative sector rankings are based on our proprietary SectorCast model, which builds a composite profile of each of over 1,400 equity ETFs based on bottom-up aggregate scoring of the constituent stocks. The Outlook Score is a Growth at a Reasonable Price (GARP) model that employs a forward-looking, fundamentals-based multifactor algorithm considering forward valuation, historical and projected earnings growth, the dynamics of Wall Street analysts’ consensus earnings estimates and recent revisions (up or down), quality and sustainability of reported earnings, and various return ratios. It helps us predict relative performance over the next 3-6 months.
In addition, SectorCast computes a Bull Score and Bear Score for each ETF based on recent price behavior of the constituent stocks on particularly strong and weak market days. A high Bull score indicates that stocks within the ETF recently have tended toward relative outperformance when the market is strong, while a high Bear score indicates that stocks within the ETF have tended to hold up relatively well (i.e., safe havens) when the market is weak. Outlook score is forward-looking while Bull and Bear are backward-looking.
As a group, these three scores can be helpful for positioning a portfolio for a given set of anticipated market conditions. Of course, each ETF holds a unique portfolio of stocks and position weights, so the sectors represented will score differently depending upon which set of ETFs is used. We use the iShares that represent the ten major U.S. business sectors: Financials (IYF), Technology (IYW), Industrials (IYJ), Healthcare (IYH), Consumer Staples (IYK), Consumer Discretionary (IYC), Energy (IYE), Basic Materials (IYM), Telecommunications (IYZ), and Utilities (IDU). Whereas the Select Sector SPDRs only contain stocks from the S&P 500 large cap index, I prefer the iShares for their larger universe and broader diversity.
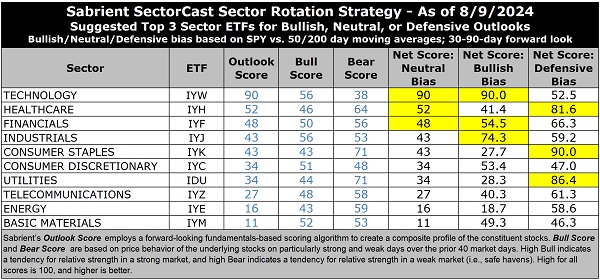
The table above shows the latest fundamentals-based Outlook rankings and my full sector rotation table. I would call the rankings neutral-to-bullish given that all-weather, secular-growth Technology (IYW) stands alone at the top with a robust Outlook score of 90 and with cyclical sectors Financials (IYF) and Industrials (IYJ) also in the Top 5. However, the latter two are right around the neutral 50 level, and all others are below 50, with a mix of cyclicals and non-cyclicals throughout the rankings. So, the rankings are certainly not strongly bullish (which would entail cyclical and economically sensitive sectors dominating the top half of the rankings with scores well above 50 and defensive sectors in the lower half).
Although much lower after the market correction, Technology still displays by far the highest forward P/E at 27.3x. But the sector scores at or near the top in every other factor, with strong forward EPS growth estimates (18.5%), a reasonable forward PEG (ratio of forward P/E to EPS growth) of 1.48, consistently positive earnings revisions from the Wall Street analyst community, by far the best return ratios, and by far the best insider sentiment (open market buying).
Rounding out the top 5 are Healthcare (IYH), Financials, Industrials, and Consumer Staples (IYK). Notably, many other sectors are again seeing positive revisions to EPS estimates, including Financials, Telecom (IYZ), Utilities (IDU), and Healthcare. Utilities, Consumer Staples, and Healthcare have been the most defensive, as illustrated by the highest Bear scores.
Notably, Energy (IYE) and Telecom display the lowest forward P/Es at 12.3x and 12.5x, respectively, with Financials close behind at 13.4x. Financials has by far the lowest forward PEG of 1.08 (forward P/E of 13.4x and a rising EPS growth estimate of 12.4%). At the bottom of the rankings are Basic Materials (IYM) and Energy, both of display negative earnings revisions, modest projected growth rates of 9.2% and 4.2%, respectively, and high PEG ratios of 2.11 and 2.96.
Keep in mind, the Outlook Rank does not include timing, momentum, or relative strength factors, but rather reflects the consensus fundamental expectations at a given point in time for individual stocks, aggregated by sector.
ETF Trading Ideas
Our rules-based Sector Rotation model, which appropriately weights Outlook, Bull, and Bear scores in accordance with the overall market’s prevailing trend (bullish, neutral, or defensive), moved to a neutral bias with the market selloff pushing SPY firmly below its 50-day moving average. It was bullish from early November until the market pullback in mid-April when it shifted to neutral (for about 3 weeks) on the S&P 500’s confirmed close below its 50-day moving average. But the model moved back to bullish in early May on the strong close back above the 50-day and remained there until last week’s selloff. (Note: In this model, we consider the bias to be bullish from a rules-based trend-following standpoint when SPY is above both its 50-day and 200-day simple moving averages, but neutral if it is between those SMAs while searching for direction, and defensive if below both SMAs.)
It now suggests holding Technology (IYW), Healthcare (IYH), and Financials (IYF), in that order. However, if you prefer a bullish stance (given the nascent bounce and improving bias of our quant rankings), the Sector Rotation model suggests holding Technology, Industrials (IYJ), and Financials. Or, if you prefer to take a defensive stance on the market (given the potential for more downside), it suggests holding Consumer Staples (IYK), Utilities (IDU), and Healthcare, in that order.
An assortment of other interesting ETFs that are scoring well in our latest rankings include: iShares MSCI Global Gold Minders (RING), Fidelity Disruptive Communications (FDCF), Invesco Next Gen Media and Gaming (GGME), AdvisorShares Vice (VICE), ERShares Entrepreneurs (ENTR), BNY Mellon Innovators (BKIV), US Global Sea to Sky Cargo (SEA), American Century Focused Dynamic Growth (FDG), Goldman Sachs Future Consumer Equity (GBUY), WBI BullBear Value 3000 (WBIF), AXS Esoterica NextG Economy (WUGI), Pacer US Large Cap Cash Cows Growth Leaders (COWG), Vanguard Communications Services (VOX), Invesco S&P SmallCap Quality (XSHQ), Inspire Fidelis Multi Factor (FDLS), Invesco Nasdaq Free Cash Flow Achievers (QOWZ), Global X Social Media (SOCL), Invesco S&P MidCap Momentum (XMMO), Alger 35 (ATFV), PGIM Jennison Better Future (PJBF), Invesco Dorsey Wright Technology Momentum (PTF), VictoryShares THB Mid Cap (MDCP), Clockwise Core Equity & Innovation (TIME), SP Funds S&P Global Technology (SPTE), First Trust Active Factor Small Cap (AFSM), and First Trust Nasdaq Lux Digital Health Solutions (EKG), and VanEck Junior Gold Miners (GDXJ). All score in the top decile (90-100) of Outlook scores.
As always, I welcome your thoughts on this article! Please email me anytime. Any and all feedback is appreciated! In particular, please tell me what sections you find the most valuable—commentary, SectorCast scores, or ETF trading ideas / sector rotation model. Also, please let me know of your interest in:
1. One of Sabrient’s new indexes for ETF investing, such as High-Quality Growth (similar to our Baker’s Dozen model), Quality Growth & Income, SMID-Cap Quality Plus Momentum, High-Quality Technology, High-Quality Energy, Quality Legacy & Green Energy, or Defensive Equity
2. Sabrient Scorecards with our full rankings of stocks and ETFs and Top 30 names for several of our proprietary alpha factors
3. Having me speak at your event.
IMPORTANT NOTE: I post this information periodically as a free look inside some of our institutional research and as a source of some trading ideas for your own further investigation. It is not intended to be traded directly as a rules-based strategy in a real money portfolio. I am simply showing what a sector rotation model might suggest if a given portfolio was due for a rebalance, and I do not update the information on a regular schedule or on technical triggers. There are many ways for a client to trade such a strategy, including monthly or quarterly rebalancing, perhaps with interim adjustments to the bullish/neutral/defensive bias when warranted, but not necessarily on the days that I happen to post this article. The enhanced strategy seeks higher returns by employing individual stocks (or stock options) that are also highly ranked, but this introduces greater risks and volatility. I do not track performance of the ideas mentioned here as a managed portfolio.
More By This Author:
Inflation And The Economy Slow, Real Rates Rise, And The Fed Is Behind The Curve
Tech Looks Bulletproof Despite High Valuations And Narrow Market Leadership
Investors Revel In A Goldilocks Outlook On Economy, Earnings, And Fed Policy


Comments
Log in or sign up to join the conversation.