
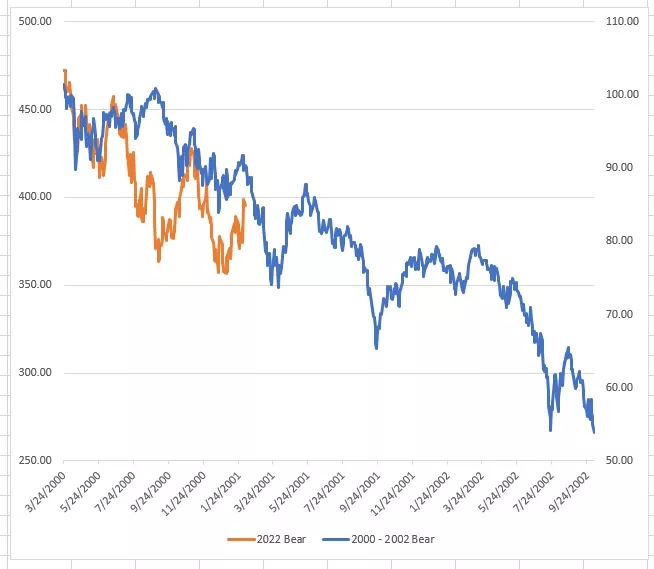
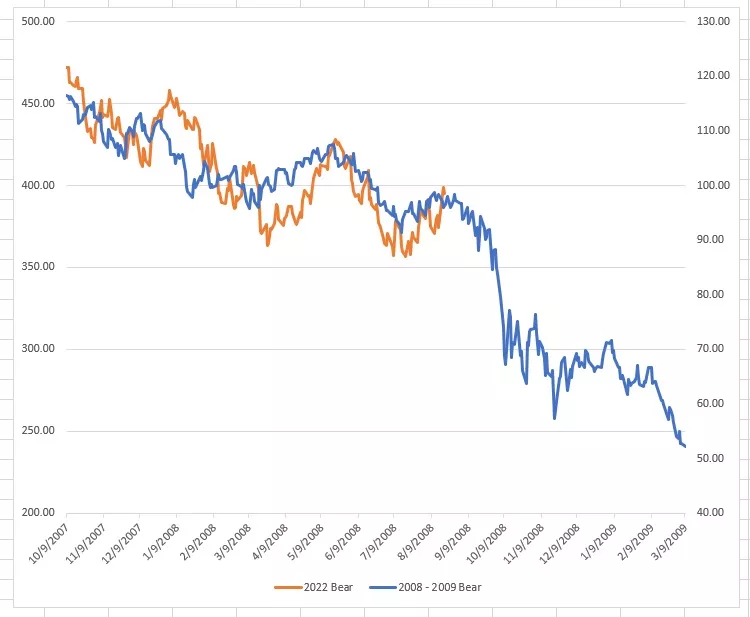
Looking at the 2000 - 20002 and 2008 - 2009 bears we can see we have much ahead of us if this year's bear plays out anywhere the same. (SPY was used as the proxy for stocks.)
Most define a bear as a 20% or more drop in prices. To see where we are so far since the most recent top in stocks, take a look at the following charts ...
Comparison with 2000 - 2002
Comparison with 2008 - 2009
More By This Author:
The Fed's Inflation Policy Appears To Be Working As Planned
An Effective Approach To Utilizing The 200 DMA
We Are Due A Recession


Comments
Log in or sign up to join the conversation.