
Warren Buffett’s Berkshire Hathaway has long viewed Apple as its crown jewel. In early 2024, Apple shares accounted for nearly 25% of the Berkshire Hathaway portfolio. However, Buffett has been selling out of Apple since then, trimming its stake by over 40%. Based on Buffett’s comments, they are reducing their holdings due to concerns about the stock’s elevated valuation, which trades at a premium to its fair market value. To wit, we share the graphic below, courtesy of SimpleVisor. The top graph shows that Apple’s stock price has doubled since 2022, while its revenue has remained relatively flat. Below the graph is a fair market calculator. The calculator uses the average of three widely used valuation metrics (Benjamin Dodd, Peter Lynch, and a basic DSM model).
Selling out of Apple shares has enabled Berkshire to amass a record $382 billion in cash while reallocating capital to new investments. To wit, Berkshire disclosed a new $4.3 billion position in Google in its Q3 2025 SEC filing, acquiring 17.8 million shares. Google is now Berkshire’s 10th-largest holding. This marks Buffett’s boldest foray into pure-play tech since initially embracing Apple. For the record, Buffett has voiced regrets for missing Google in the past. He once said he “blew it” despite seeing its potential firsthand through Berkshire’s Geico ads. With Alphabet’s shares up 46% year-to-date on AI and data center momentum, the move underscores a nuanced shift: blending value discipline with selective growth exposure. Bear in mind that Warren Buffett is stepping down as CEO by year-end. Thus, selling out of Apple and into Google might be the workings of Berkshire’s new managers.

What To Watch Today
Earnings
(Click on image to enlarge)

Economy
(Click on image to enlarge)

Market Trading Update
Yesterday, we did a complete technical review of the market. However, tomorrow is the most anticipated earnings report of the quarter: Nvidia (NVDA).
Nvidia reports Q3 fiscal 2026 earnings after the close on Wednesday, November 19. Expectations are set high. Wall Street forecasts revenue between $54 billion and $55 billion. That’s more than 50% growth from last year. EPS is expected to be around $1.25.
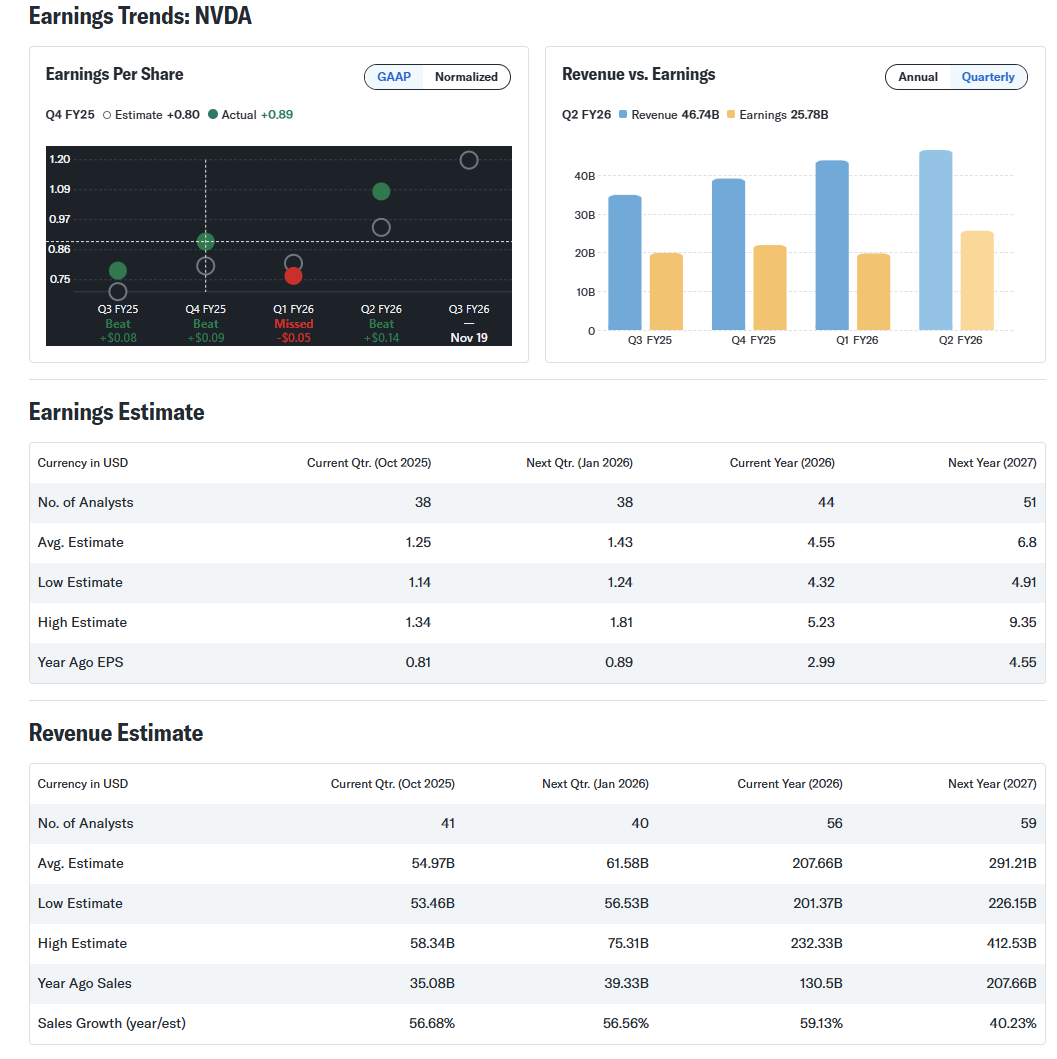
Investors will focus on three metrics: data center revenue, GPU sales tied to AI infrastructure, and guidance for the next quarter. Nvidia’s ramp of the Blackwell GPU architecture is expected to drive upside, particularly from hyperscalers like Microsoft, Amazon, and Google. But at this stage, strong results are assumed. The bar isn’t low—it’s been set by months of AI optimism and price appreciation.
Nvidia is one of the largest weights in the S&P 500 and Nasdaq. That makes this earnings release a market event. If Nvidia misses or guides conservatively, the broader indexes could see downside pressure. However, the risk goes beyond earnings. Policy risk remains a potential issue if the U.S. government expands chip export restrictions to China. That could limit sales of high-performance GPUs in 2025 and beyond. Even if Q3 numbers are strong, commentary on demand visibility and geopolitical risk will shape the stock’s direction.
Lately, even if the news is good, stocks have declined. Notably, investors have little tolerance for bad news, especially when sentiment is high. Options traders are betting on a sharp move after earnings. The implied volatility in weekly options expiring on November 21 suggests a move of around ±7% to ±8%. With the stock trading near $185, the market is pricing a post-earnings range between $170 and $200.
Calls are more expensive than puts, reflecting optimism, but also asymmetrical risk. A significant beat with confident guidance could push shares above the $200 level. But a soft outlook could send the stock into the low $170s quickly. That setup suggests one of two outcomes: a breakout rally if Nvidia outpaces estimates and upgrades its outlook, or a sharp pullback if results underwhelm, even if earnings beat estimates by only a slight margin.
If you hold Nvidia shares, be prepared for volatility. The stock has increased by over 200% since the start of 2023. Gains of that magnitude raise the stakes for every earnings report. Keep the focus on forward guidance. This quarter’s results matter, but commentary on 2026 demand, data center growth, and international exposure will drive the stock more than headline EPS.
Nvidia’s earnings won’t just affect its stock price, but will likely move the entire AI and Technology sector with it.
Why Rotate?
We often discuss rotating among different stocks, sectors, and factors. The reason is simple: there are always stocks, or types of stocks, that are outperforming the market, and others that are underperforming. With the proper tools, rotating between different stocks can add returns versus common passive investment approaches. We recently discussed rotation with Adam Taggart on Thoughtful Money. Starting around the 9:00-minute mark, we share the first graph below and others to appreciate the rotation in the current environment.
The graph below shows that the relative performance of staples has been poor compared to the S&P 500. Moreover, its relative performance has been almost the mirror image of the technology sector’s. The second graphic shows that performance has shifted very recently slightly in favor of staples and away from technology. Note, as shown in the graph on the right side of the second SimpleVisor graphic, Technology has moved from the upper right (indicating overbought conditions on both relative and absolute bases) toward the center. Conversely, Staples has gone from oversold on both metrics to the center as well. Over the last ten trading days, Staples has beaten the S&P 500 by about 2.5%, while Technology has given up 2.5% to the market. For an investor who accurately timed that rotation and shifted from technology to staples, they would have earned an additional 5% versus their prior position.


Full Market Cycles: Half Bull Half Bear
Many readers asked what I meant by a full market cycle and why it matters today. The chart above showing inflation-adjusted S&P 500 prices since 1871 makes it clear: every bull market is eventually followed by a bear market. Together, these form a full cycle.
Throughout history, bull market cycles are only one-half of the “full market” cycle. This is because during every “bull market” cycle the markets and economy build up excesses that are then “reverted” during the following “bear market.” In the other words, as Sir Issac Newton once stated:
“What goes up, must come down.”
The current cycle remains incomplete, but history suggests that the second half usually retraces much of the prior gains. Logical downside targets often align with past peaks, such as those in 2000 and 2008..
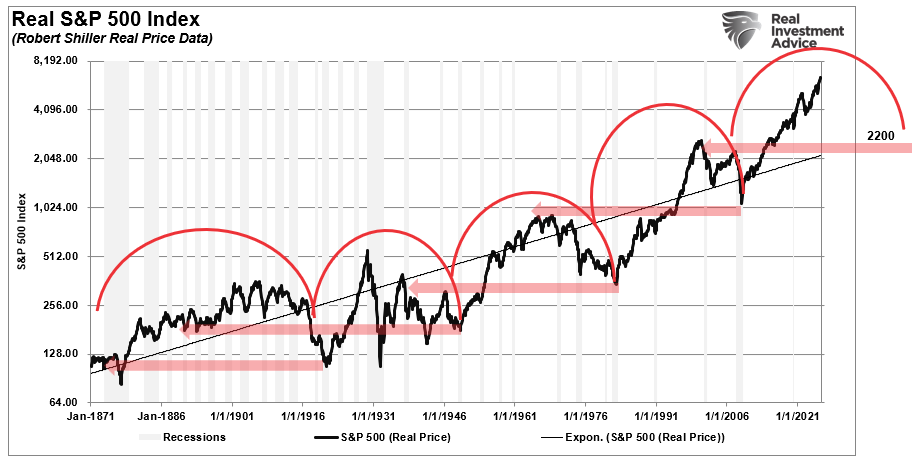
Note: I am not stating that I “believe” the markets are about to crash to the 2200 level on the S&P 500. I am simply showing where the previous support intersects with the price. The longer that it takes for the markets to mean revert the higher the intersection point will be. Furthermore, the 2200 level is not out of the question either. Famed investor Jack Bogle stated that over the next decade we are likely to see two more 50% declines. A 50% decline from current levels would put the market below 3400 which would be in the “ballpark” of completing the current full market cycle.
As I have often stated, I am not bullish or bearish. My job as a portfolio manager is simple: invest money in a manner that creates returns on a short-term basis, but reduces the possibility of catastrophic losses, which wipe out years of growth.
Nobody tends to believe that philosophy until the markets wipe out about 40-50% of portfolio values over a relatively short period. But that is why it is crucial to understand that markets do cycle, and this time is likely “not different.”
Tweet of the Day

More By This Author:
Full Market Cycles: Half Bull And Half BearEconomic Reacceleration: A Contrarian View
The Bearish Bond Narrative Fades


Comments
Log in or sign up to join the conversation.