
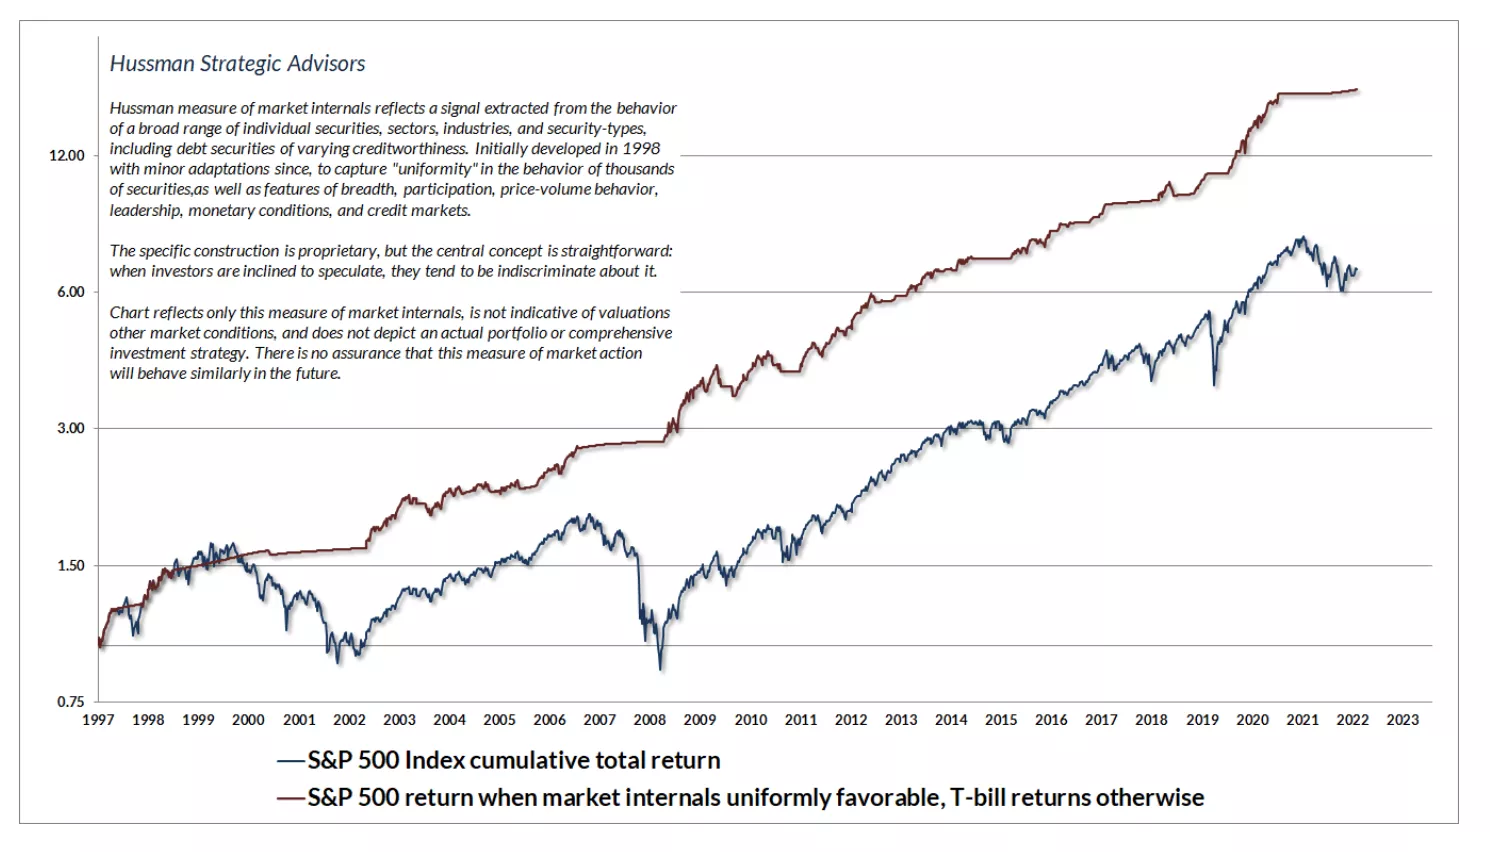
The chart is historical and does not reflect a portfolio of investments. The chart below shows times when market internals were consistently unfavorable, similar to last year, and we preferred T-bills or hedged equity to unhedged market risk. During the crashes of 2000–2002 and 2007–2009, you'll notice the same pattern.
Source: Dr. JOHN HUSSMAN
More By This Author:
Wave-Trend Update: Equities
Investing In Desalination
Watch Out For The Volatility Gremlins


Comments
Log in or sign up to join the conversation.