Watch Out For The Volatility Gremlins
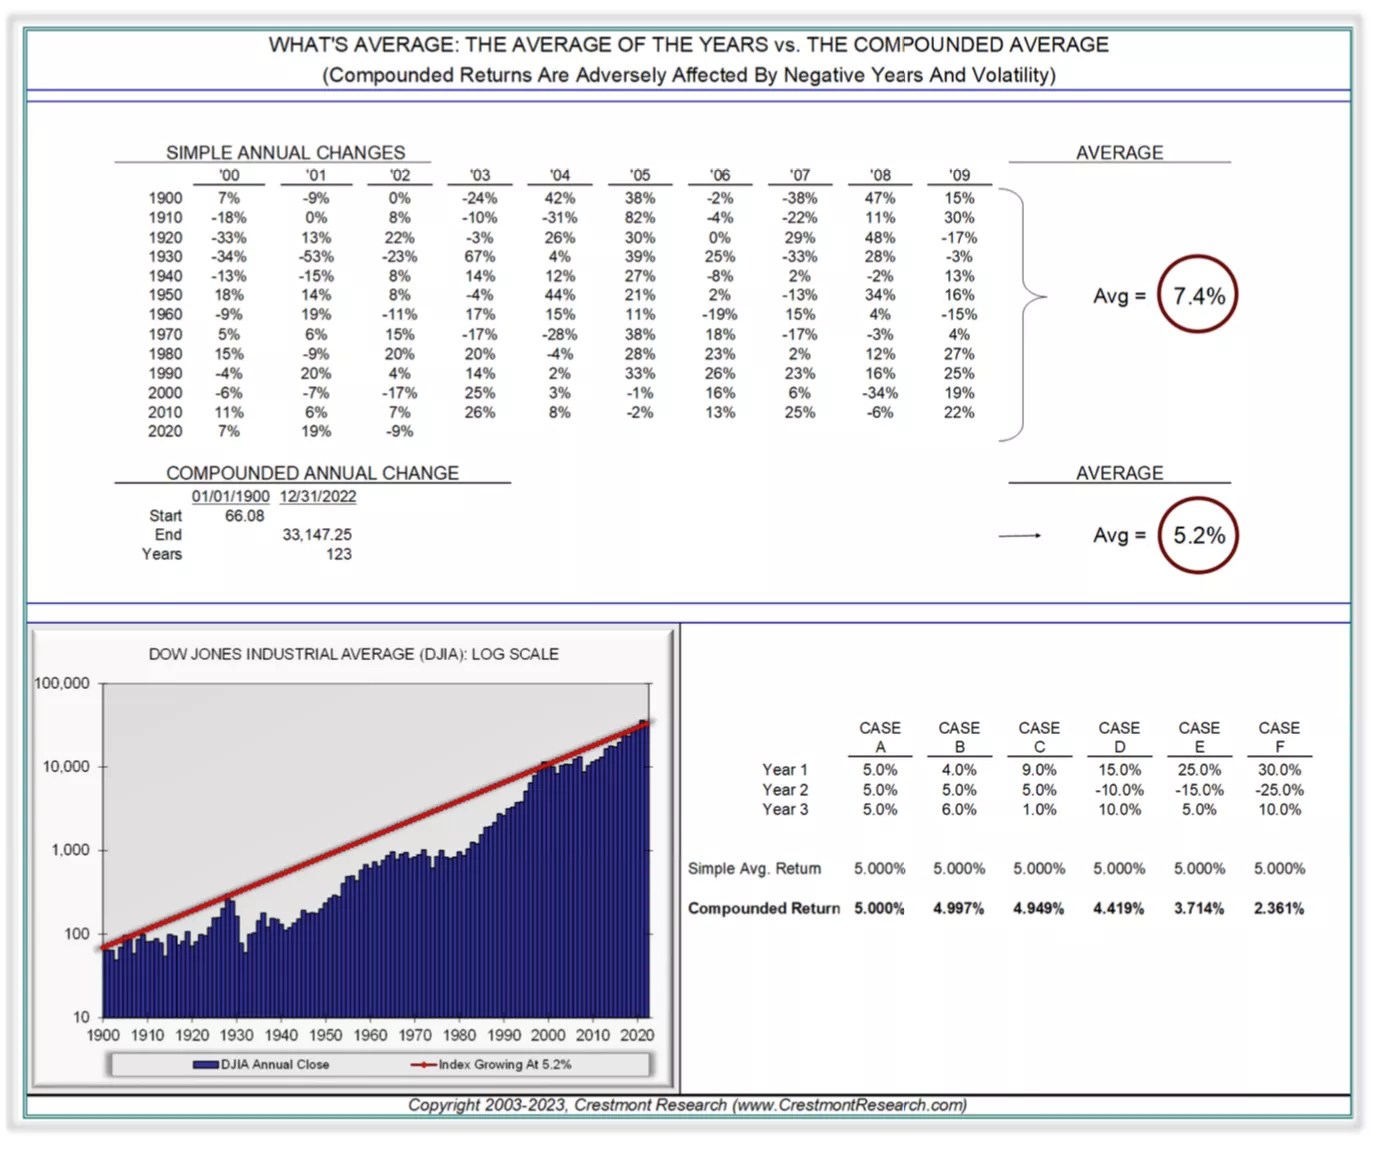
Only compounded returns, or geometric returns, are spendable by investors; ordinary returns cannot (i.e., arithmetic). This graph illustrates how average returns and compound returns differ for investors.
The impact of negative numbers and the impact of volatility, as determined by the fluctuation within a series of returns, are the two topics evaluated. The actual returns investors receive compared to the average can be completely destroyed by both problems.
This example illustrates the first problem with negative numbers: even though a gain of 20% and a loss of 20% may average zero, the net effect is always a loss (100 + 20% = 120 — 20% = 96 or 100 — 20% = 80 + 20% = 96).
Another illustration of the second dynamic, volatility, is the compounded return from three periods of returns is greater than any other sequence that
averages 5%.
(Click on image to enlarge)

To learn about a low volatility strategy, go to Wave-Trend
More By This Author:
Momentum/Trend Following Does Well In Inflationary Periods
The Built-In Return Advantage Of Avoiding Loss
The One Asset Class That Holds Up With Inflation
Disclaimer: These illustrations are not a solicitation to buy or sell any ETF. I am not an investment advisor/broker


