

Image Source: Pexels
Buckle Up! With the end of the government shutdown and the return to work of government employees comes a flood of economic data. Below is a list of old economic data that should be released over the coming weeks:
- BLS Employment Report- October report was scheduled for November 7th. September’s report will be skipped entirely.
- CPI Report- September’s report was released in late October. October is due this Wednesday, but will likely be delayed.
- PPI Report- Unlike CPI, there was no September report. The Ocotber report is due on Friday but will be delayed. Its unclear if the September report will be released.
- PCE Price Index- September’s report was due on October 31st. CPI data is needed to complete the report, thus it may be a while for the report to be released.
- Retail Sales- Missing September data. October’s report is due on Friday but will be delayed.
The list goes on. But, of more importance is whether or not the markets will care about the September economic data. We think the data from the private sector, like ADP, Truflation, and various surveys have given us a good feel for what the labor market and inflation are doing. That said, there will be a slew of economic data coming over the next few weeks and we should not rule out volatility as a result.
What To Watch Today
Earnings
(Click on image to enlarge)

Economy
(Click on image to enlarge)

Market Trading Update
Yesterday, we covered the technical backdrop of the market, which continues to be one of “buy the dips,” but with poor breadth. Last week was undoubtedly a rough week for the big technology stocks, but on Friday, the markets bought at the 50-day moving average, and that buying continued through yesterday in the Technology Sector. As shown in the next section, technology stocks were deeply oversold relative to the market, so the reversal is not surprising.
Furthermore, Friday’s “hammer candle” reversal was also a bullish sign for the market, and yesterday, the market reclaimed the 20-day moving average. This all aligns with a continued bull market advance for now.
(Click on image to enlarge)
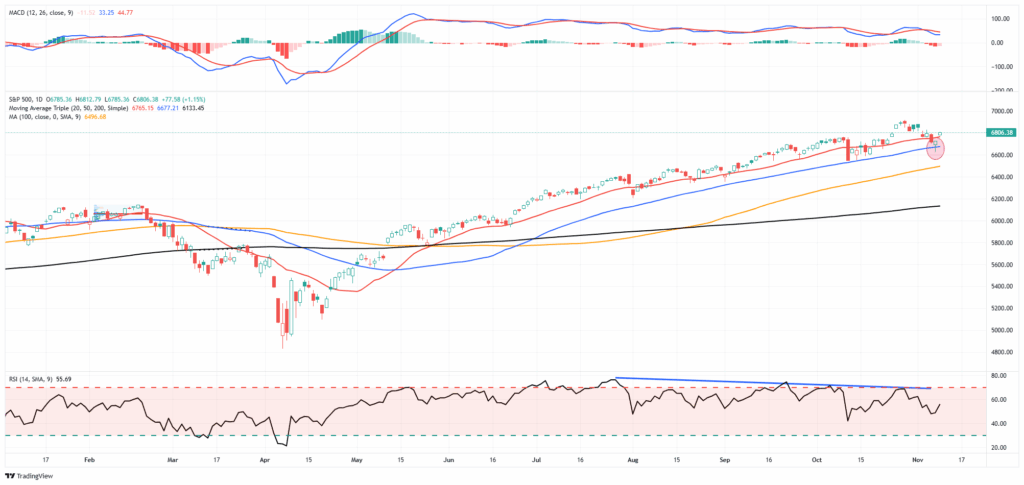
A little bit of early November weakness is not uncommon, but the week before, and following Thanksgiving tends to be stronger as trading volume lightens up and the “inmates are in charge of the asylum.” Also, note that the first two weeks of December tend to be weak, as mutual funds distribute annual gains and income. That pullback then sets up the traditional “Santa Claus” rally into year-end.

Every time technology becomes overbought, as we noted a couple of weeks ago and suggested rebalancing holdings, a correction becomes likely. When that pullback occurs, the media assumes it’s the end of the AI trade. It most likely isn’t, and is why we continue to pay attention to the market rotation setup and why carrying some diversification in your portfolio is essential.
Trade accordingly.
Reversal Of Fortunes Helps Breadth
One bad week for many of the Magnificent Seven stocks, and as a result, the market’s breadth is improving, at least according to the SimpleVisor short-term overbought/oversold relative indicators. The table below from SimpleVisor shows the relative returns (vs. S&P 500) over the last five days and the 40 days before that. The over- and underperformance of sectors is easy to spot. While last week’s reversal of prior trends was a step in the right direction, the poor breadth remains problematic, as we share in a quote and graphic below the excess returns table. Did last week’s activity create enough of a correction in the largest stocks to allow the prior trend to continue? Or will breadth continue to improve with the largest stocks underperforming most others?
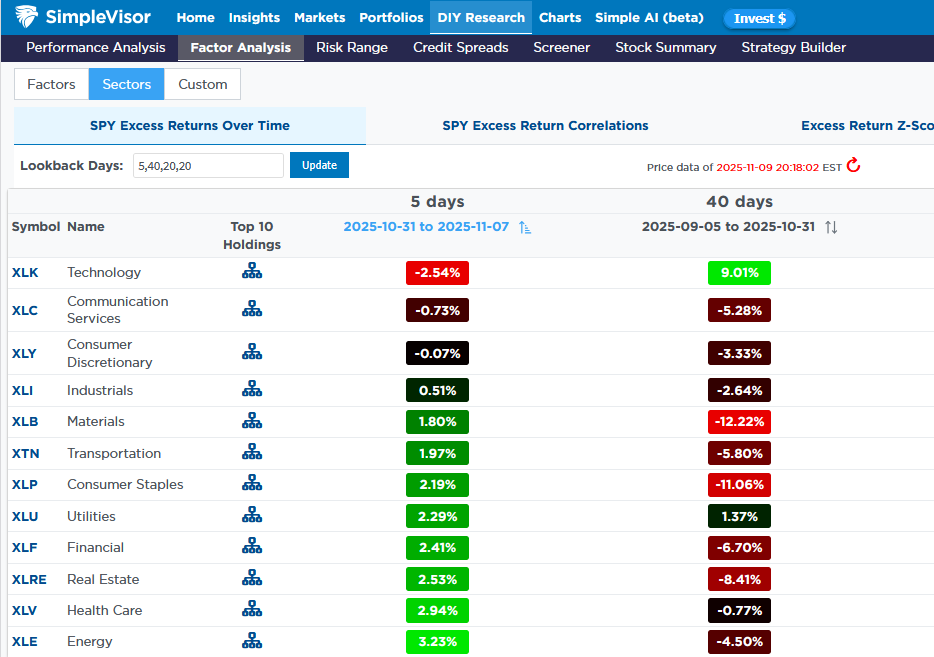
Last week’s activity was a step in the right direction to providing some stability to the markets. However, breadth remains concerning. Consider the following quote and graph from Monday’s Commentary:
Breadth has notably deteriorated, with the number of stocks outperforming the benchmark index at levels typically associated with larger market corrective processes. Fewer stocks are participating in the upside, and internal momentum is fading. As of Friday, only 55.4% of S&P 500 components remained above their 200-day moving average, a meaningful decline from earlier levels this year. The number of stocks above their 50-day moving average has dropped even more sharply, down to just 40%, with participation narrowing in key sectors.

Forward Returns And The Importance Of Math
During strongly trending bull markets, investors often overlook the importance of math in predicting forward returns. Such is easy to do when the market just seemingly continues to rise without regard to fundamentals. The current environment is also heavily influenced by the impact of “passive indexing,“ which has distorted market dynamics as well. However, none of this should be surprising, given one of the longest cyclical bull markets in history; individuals are optimistic about the long-term prospects of investing. The ongoing interventions by global Central Banks have led to T.T.I.D. (This Time Is Different) and T.I.N.A. (There Is No Alternative), which has become a pervasive, and “Pavlovian,“ investor mindset.
But as the famous Paul Harvey used to say: “Then there is the rest of the story.”
The chart below illustrates every economic expansion dating back to 1871, along with the subsequent market decline. (Note: the current bull market cycle that started in March 2020 is still running.)

This chart should make one point very clear – this cycle will end.
However, for now, there is little doubt that the bullish bias exists, as individuals continue to hold historically high levels of equity and leverage, chasing yield in the riskiest areas, and maintaining relatively low levels of cash.
Tweet of the Day

More By This Author:
Forward Return And The Importance Of MathOne Trillion Dollar Package For Musk If He Delivers
Repo Market: Critical Warning Or Bullish Signal


Comments
Log in or sign up to join the conversation.