
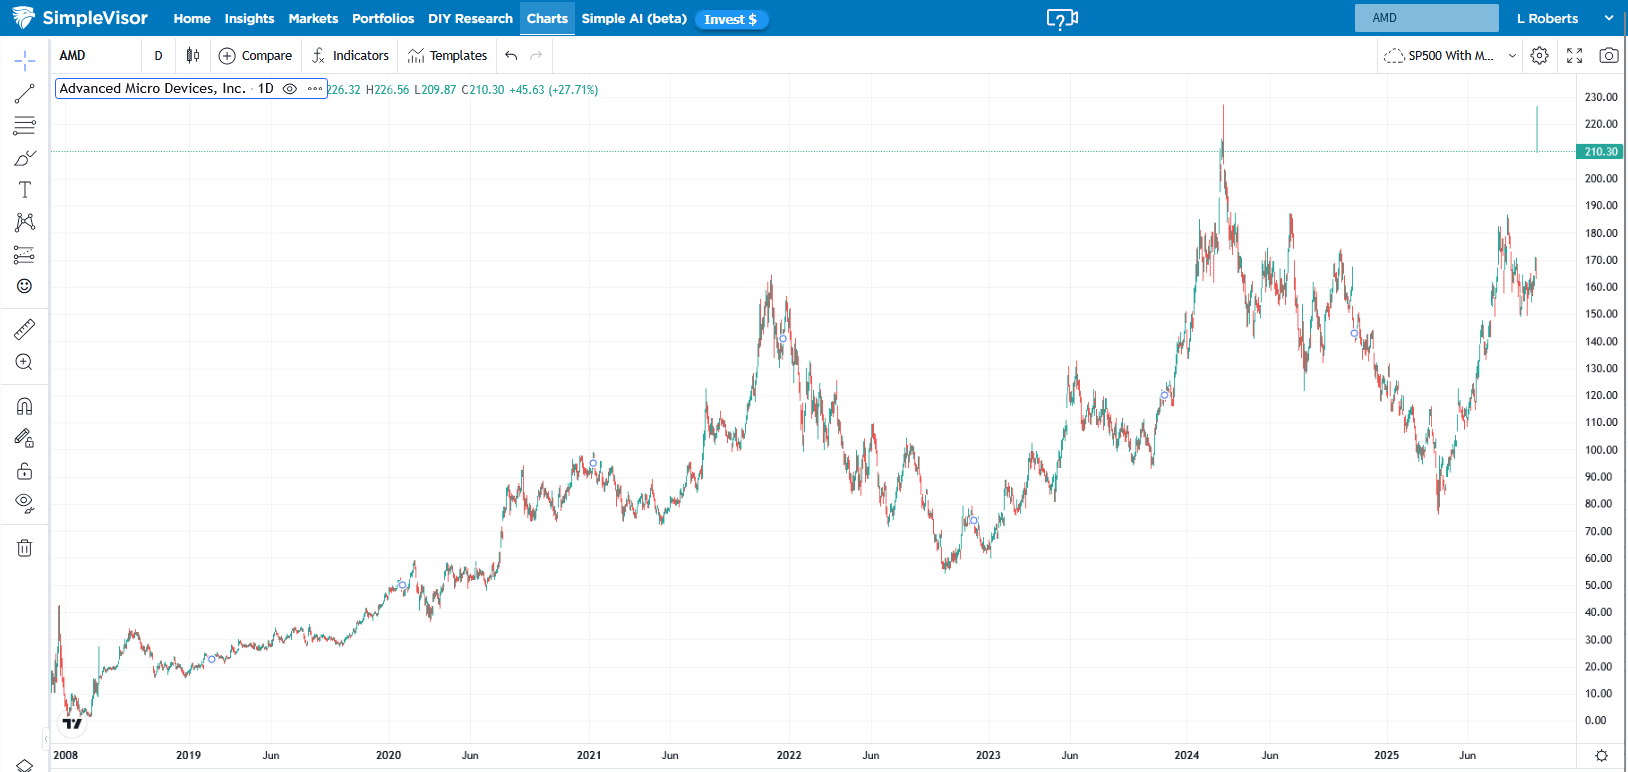
Advanced Micro Devices (AMD) stock opened up by nearly 35% on Monday morning, following reports that OpenAI is acquiring a 10% stake in AMD. As part of the agreement, AMD will supply OpenAI with 6 gigawatts of AMD’s Instinct GPUs. The deal is scheduled to start with a 1-gigawatt rollout in 2026.OpenAI will receive warrants for up to 160 million AMD shares (approximately 10% of the company) at $0.01 per share, contingent upon meeting certain deployment milestones and an increase in AMD’s stock price. Not surprisingly, the deal is well-touted by both executives, as seen below:
This creates a true win-win, enabling the world’s most ambitious AI buildout and advancing the entire AI ecosystem. – Lisa Su, CEO and Chair of AMD
The deal with AMD will help OpenAI build enough AI infrastructure to meet its needs.- Sam Altman, CEO of OpenAI
What we find interesting about this deal is that Nvidia recently made a $100 billion investment in OpenAI. Thus, indirectly, Nvidia’s funds are being put to use by investing in one of its biggest competitors, AMD. The AMD deal is expected to intensify competition in the AI chip market, where Nvidia currently holds over 80% market share. As a result, AMD chips are expected to ease global AI-related chip supply bottlenecks. Moreover, the deal should pressure Nvidia to innovate more quickly and reduce prices to retain its leadership. For Nvidia (NVDA), it signals a tangible market share risk from AMD’s aggressive push into high-performance AI accelerators, which could erode Nvidia’s premium pricing power and investor confidence if more hyperscalers follow OpenAI’s lead.
(Click on image to enlarge)
What To Watch Today
Earnings
(Click on image to enlarge)
![]()
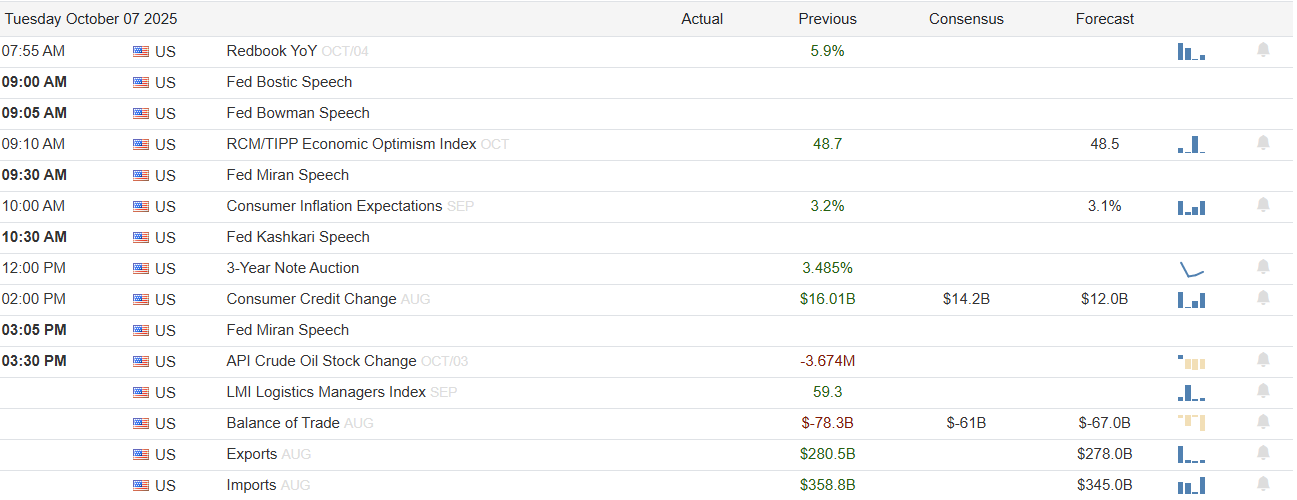
Economy
(Click on image to enlarge)
Market Trading Update
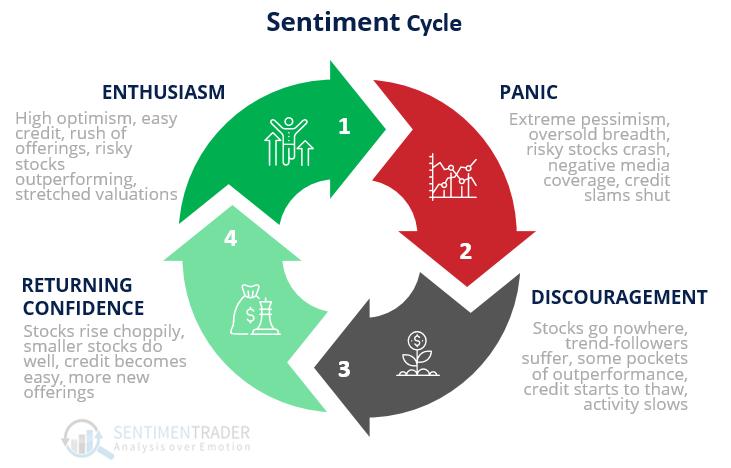
Yesterday, we discussed the technical backdrop of the market, which remains bullishly biased. As noted, a broad range of asset classes are now trending together from small and mid-caps, to emerging and international, large cap growth and momentum, commodities, precious metals, and crypto. In other words, money is chasing every asset class and making up narratives for each to support the rise. Of course, in extremely bullish markets, such should be expected as sentiment cycles from confidence to enthusiasm. (chart courtesy of Sentiment Trader.)
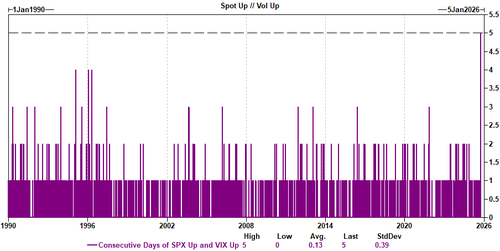
Looking at the current market backdrop, the distortions being created are notable. As I noted on X yesterday, Goldman’s top derivatives trader, Cullen Morgan, points out something unprecedented: this past week saw the S&P green five days in a row for a return of +1.09%. At the same time, the VIX Index was up 1.36 points, ALSO notching five consecutive days higher. This was truly unprecedented: since the creation of VIX in 1990, this has never happened before.
Of course, the question is, why is this occurring? As Morgan notes, call option volumes have exploded amid relentless demand for single stock options. (This is retail speculation.)
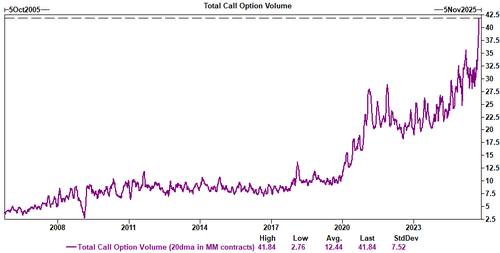
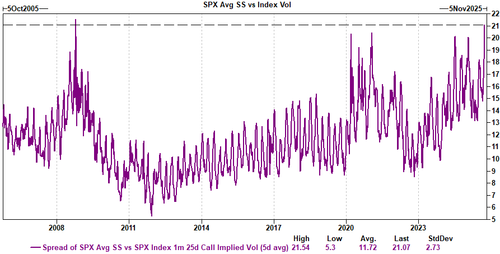
In turn, that surge in single stock call option volume feeds into the underlying stocks, which bleeds over into the index as a whole. As Morgan concludes: “In fact, if you look at the spread of single stock volatility to index volatility, its at one of the widest levels we have ever seen.”
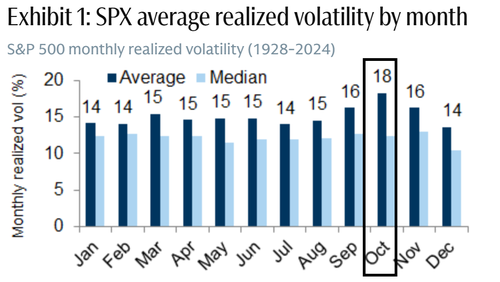
“Some facts: October has historically seen a big pickup in volatility: For example, over the past 96 years, S&P realized volatility has increased 26% from August to October on average. While some consider it a coincidence that major market corrections have occurred in October, Goldman believes performance pressures for company managements (to meet full year expectations) and investors (final earnings catalysts for their performance year) exacerbate shifts in investor sentiment at this time of year. Indeed, shares and single stock options volumes over the past 29 years have peaked in the month of October on average.” – Zerohedge
While there is a very high level of complacency in the market right now, it won’t take much to spark a decent selloff to nearby support levels. More importantly, as noted, given the more extreme extensions in a variety of asset classes, the reversal could be broad, catching numerous participants offside. Regardless of your asset class, some risk management remains a prudent suggestion despite the current high conviction rate in the market. From a contrarian perspective, it seems wise to swim a little closer to the edge when everyone is in the pool.
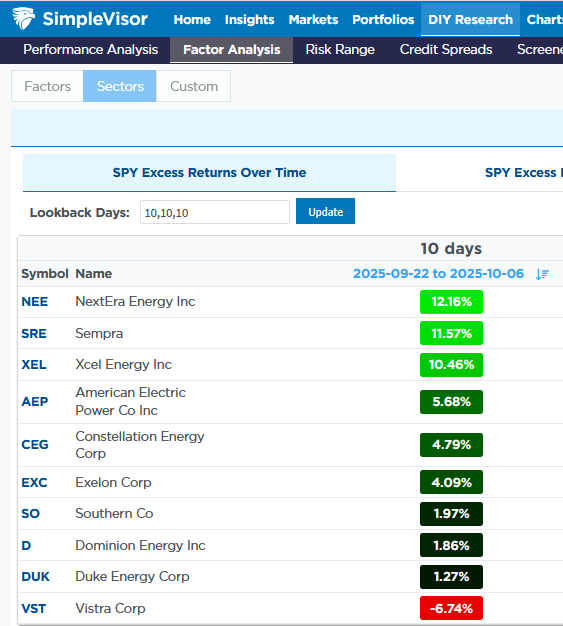
Utilities vs. Staples Is At Extremes
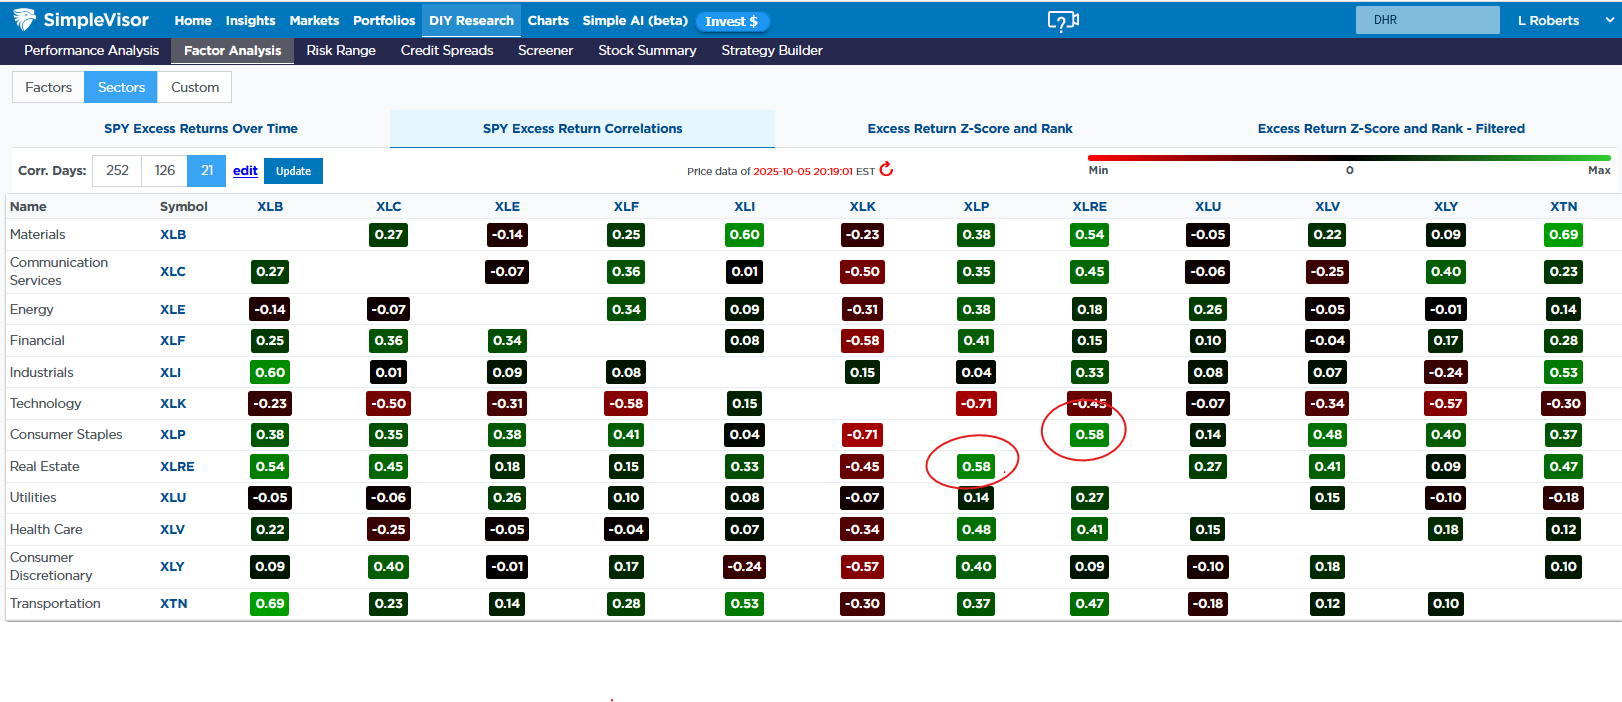
Per our SimpleVisor relative analysis, Utilities are the second most overbought sector, while Staples are the most oversold. More often than not, both “conservative” sectors tend to correlate well with each other. That has not been the case recently.
The first table below shows that the correlation between the returns of utilities (XLU) and staples (XLP) is 0.58. While statistically significant, it is well below its longer-term average. The second graphic confirms that sentiment. The relationship is 2.44 standard deviations from its norm. Finally, the third graph shows that the relationship has reached its most divergent point in the last year.
While the relationship can certainly diverge further, we should expect the correlation to increase, which may likely portend relative strength in the staples sector compared to the utilities. We do caution that the divergence is primarily due to a few alternative energy and nuclear-related utilities significantly outperforming the broader utility sector. Thus, a convergence of the relationship may not impact all utilities equally. The high-flying utility stocks, as highlighted in the fourth graphic, may be most at risk.


Bear Market Losses: A Dangerous Illusion
When bear market losses occur, headlines talk in percentages: “The market dropped 20 %.” Investors nod. A 20 % decline sounds manageable, historical, and expected. As Ben Carlson recently penned:
“Bear markets have some symmetry to them, at least in the short-term. In the long term, bull markets versus bear markets are asymmetric. Things are not balanced.
Look at the gains versus losses. The bear markets are blips. To be fair, those losses don’t feel like blips when you’re in them. Bear markets can be brutal. Losing money is not fun. Seeing a large portion of your portfolio get vaporized can cause you to question your sanity as an investor. And yet…the bull markets completely overwhelm the bear markets. It’s not even close.
This certainly seems to be true when looking at a chart of “percentage returns. “ The chart below uses monthly, inflation-adjusted returns for $1000 invested in the S&P 500 index (data via Robert Shiller, Yale University)

However, looking at the markets this way and assuming that “bull markets” have dwarfed “bear markets” throughout history creates an “illusion of safety.” This is why such mainstream and mundane analysis is only used to deter concerns about market downturns and suggest that investors remain fully invested at all times.
Tweet of the Day

More By This Author:
Corporate Prices Lead Consumer PricesBear Market Losses – A Dangerous Illusion
Bubble In AI: Echoes Of The Past, Lessons For The Present


Comments
Log in or sign up to join the conversation.