
When bear market losses occur, headlines talk in percentages: “The market dropped 20 %.” Investors nod. A 20 % decline sounds manageable, historical, and expected. As Ben Carlson recently penned:
“Bear markets have some symmetry to them, at least in the short-term. In the long term, bull markets versus bear markets are asymmetric. Things are not balanced.
Look at the gains versus losses. The bear markets are blips. To be fair, those losses don’t feel like blips when you’re in them. Bear markets can be brutal. Losing money is not fun. Seeing a large portion of your portfolio get vaporized can cause you to question your sanity as an investor. And yet…the bull markets completely overwhelm the bear markets. It’s not even close.
This certainly seems to be true when looking at a chart of “percentage returns. “ The chart below uses monthly, inflation-adjusted returns for $1000 invested in the S&P 500 index (data via Robert Shiller, Yale University)

However, looking at the markets this way and assuming that “bull markets” have dwarfed “bear markets” throughout history creates an “illusion of safety.” This is why such mainstream and mundane analysis is only used to deter concerns about market downturns and suggest that investors remain fully invested at all times.
But ask yourself these two simple questions:
- If true, why does no legendary investor “buy and hold” the market?
- Why does every legendary investor have one rule in common: “to buy low and sell high” in some form? From Warren Buffett to Paul Tudor Jones, the investing greats warned about the peril of market drawdowns and the risk to investment capital.
While Ben is correct in the overall analysis, the framing is misleading. As we will discuss in detail, the chart, originally put out by First Trust, hides the real damage to your portfolio, goals, and timeline. As noted, bear market losses, when displayed in percentages, obscure what it takes to recover. Furthermore, it ignores the most critical commodity of all investors: the “time” lost and the destruction of the “compounding effect.”
A 20 % or more bear market loss is not just a dip. It’s a reset. It drags down the current value of your investments and your future wealth. The more profound the loss, the more ground you need to make up, and the longer it takes. Investors think they can ride it out. However, many behavioral studies show this is not the case, and that investors eventually “sell” as the “loss avoidance” kicks in. That is when the real damage is done.
Most market commentary glosses over that. It speaks in long-term averages and smooth recoveries, assumes you stay the course and never sell, and that you’re not withdrawing funds. Those assumptions rarely hold up under pressure. Markets don’t move in straight lines. Neither do portfolios. Understanding the real cost of a bear market means looking beyond percentages.
Let’s explore the math.
The Math of Loss
Losses hurt more than they appear because recovery isn’t symmetrical. If your portfolio drops 20 %, you need a 25 % gain to get back to even. Drop 30 %, and you need nearly 43 %. A 50 % loss? That takes a 100 % rebound. These aren’t abstract numbers; they’re the reality of compounding in reverse.
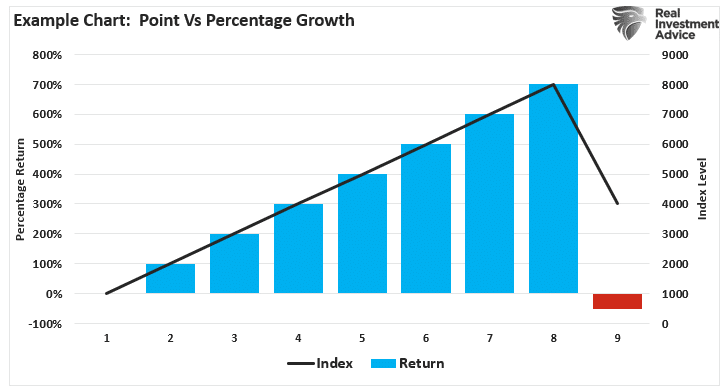
Let’s assume that an index goes from 1000 to 8000.
- 1000 to 2000 = 100% return
- The index rises to 3000 = 200% return
- Going on to 4000 = 300% return
- …
- And continues to 8000 = 700% return
If an investor bought the index and generated a 700% return on their money, why worry about a 50% correction?
Here is the problem with percentages.
A 50% correction does NOT leave you with a 650% gain.
A 50% correction subtracts 4000 points, reducing your 700% gain to 300%.
Source: St. Louis Federal Reserve Chart by: www.RealInvestmentAdvice.com
As shown in the example, the small drawdown seems innocuous until you realize it clipped 4000 points from the index. The problem now becomes the issue of regaining those 4000 lost points to break even.
Understanding the math of loss is incredibly important.
Real life works the same. From 2007 to 2009, the S&P 500 lost over 56 %. To recover that, investors needed more than 113 % in gains. The market didn’t break even again until 2013. That’s six years to claw back losses. And that assumes no withdrawals and full participation in the rebound. Most investors didn’t make it. They panicked, went to cash, and missed the recovery.
Let’s reconstruct the chart above from the percentage gain and loss chart into actual point changes. In this form, we see that most of the advances in bull markets get subsequently destroyed in bear markets.

As of this analysis, the market was trading at 6700. A 50% correction would result in a loss of 3350 points, wiping out most of the gains from the October 2022 lows.
No, that would not just be a blip. That is because volatility compounds the damage.
When looking at things in percentages, gains and losses of equal size do not cancel out. A 10 % gain and a 10 % loss still leaves you down. If you start with $100,000, gain 10 % to $110,000, then lose 10 %, you’re at $99,000. The sequence matters. High volatility drags on returns even if long-term averages look fine. That’s called volatility drag, and it eats away at portfolios quietly.
Drawdowns are more than temporary events. They are mathematical traps. The deeper the fall, the more challenging the climb. And every investor who ignores this does so at their own risk.
The Fallacy of Compounding and the Math of Time
Bear markets don’t just reduce your portfolio value. They rob you of time. Time is also the most valuable resource when investing. You can recover money. You can’t recover time.
Let’s assume that an investor wants an “average” rate of return over a five-year horizon. Since markets have volatility, we can inject a minor correction to see the impact of losses.
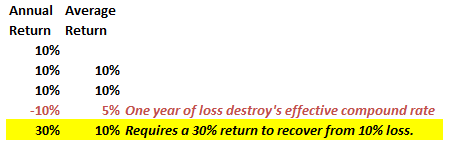
After three straight years of 10% returns, a bear market loss of just 10% cuts the average annual compound growth rate by 50%. Furthermore, it then requires a 30% return to regain the required average rate of return.
There is a significant difference between AVERAGE and ACTUAL returns. The impact of losses destroys the annualized “compounding” effect of money.
To prove that, the purple shaded area shows the “average” return of 7% annually. However, the differential between the promised and “actual return” is the return gap. See the problem?
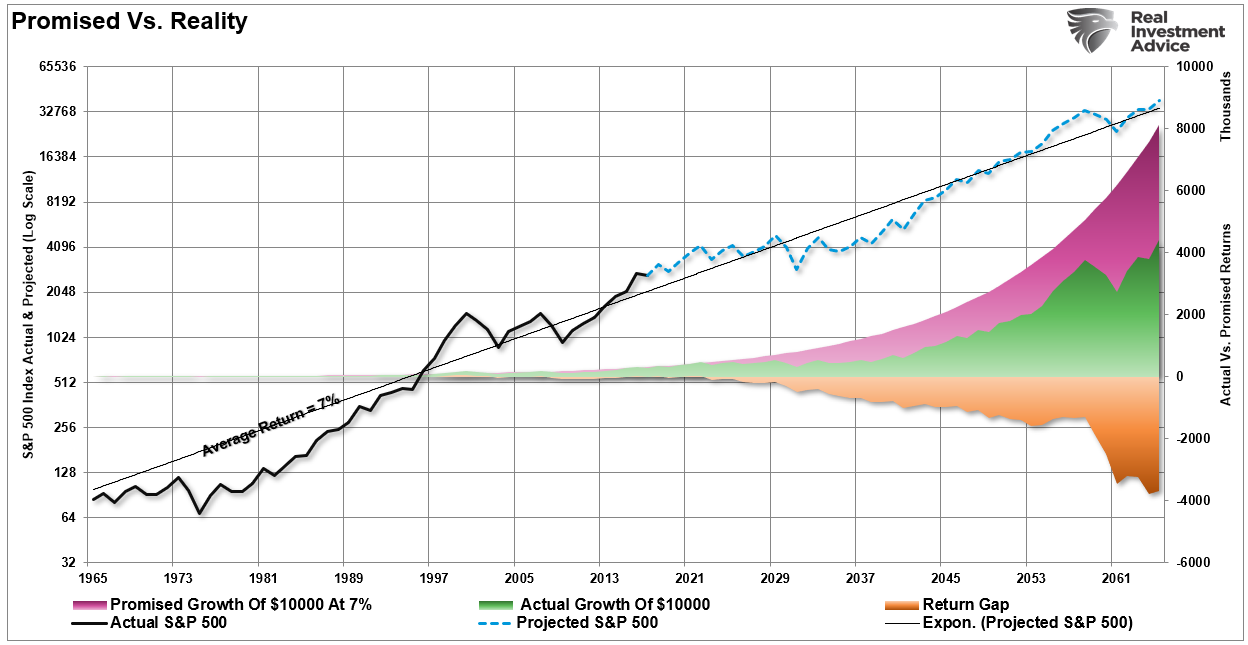
The differential between what investors were promised (and a critical flaw in financial planning) and actual returns is substantial over the long term.
Secondly, and most importantly, you DIED long before you realized the long-term average rate of return.
The chart box below shows a $1000 investment for various starting periods. The total return holding period is from 35 years until death using actuarial tables. There are no withdrawals. The orange sloping line represents the “promise” of 6% annualized compound returns. The black line represents what occurred. The bottom bar chart shows the surplus, or shortfall, of the 6% annualized return goal.
(Click on image to enlarge)

At the point of death, the invested capital is short of the promised goal in every case except the current cycle starting in 2009. However, that cycle is yet to be complete, and the subsequent bear market loss will likely reverse most, if not all, of those gains.
As such, if your plan is based on compounding returns over 20 or 30 years, even a short disruption can have long-term effects. This effect is worse for those nearing retirement. If a bear market hits five years before retirement, you don’t have time to wait. You may need to delay retirement, reduce your spending goals, or work longer. Worse, the damage is permanent if you’re already retired and drawing down funds during a bear market as every withdrawal during a downturn locks in a loss. Even if the market recovers, your portfolio doesn’t, because you pulled money out when prices were low.
This is the sequence-of-returns problem. If your first years of retirement coincide with a bear market, your odds of running out of money rise sharply. Studies show that retirees who withdraw 4 % per year and face a 30–40 % loss early in retirement have a much higher failure rate. The order of returns matters far more than average returns.
If someone suggests that you ignore bear market corrections, ask them if they have ever been through one.
Investors often plan as if markets will deliver average returns smoothly. They don’t. Bear markets distort the timeline, and time lost compounds into permanent gaps in your financial plan.
Strategies That Work When Markets Don’t
Understanding the real cost of bear markets is the first step. What matters is acting on that knowledge. Here are six strategies that help protect your portfolio and your plan when markets break down.
- Limit the downside. Avoiding significant losses matters more than capturing every bit of upside. A portfolio that loses less in bear markets recovers faster and compounds more. Risk management is return management. Limiting losses to 10 % instead of 30 % requires less time and less risk to recover.
- Maintain a cash buffer. Have two to three years of living expenses in cash or short-term bonds. This prevents you from selling assets at a loss during a downturn. A cash reserve acts as dry powder and protects your long-term investments.
- Rebalance with discipline. When markets fall, your equity allocation shrinks. A disciplined rebalancing schedule forces you to buy low and sell high. But only if you are disciplined to follow through when fear is high.
- Use tactical risk shifts. Reduce equity exposure when valuations are stretched. Add exposure when risk premiums are higher. Avoid going all-in or all-out. Stay flexible, but don’t chase trends. Focus on risk-adjusted outcomes.
- Protect in retirement. If you’re near or in retirement, reduce sequence risk. Lower your withdrawal rate during market stress. Delay big spending. Hold more conservative allocations. The early years of retirement are fragile. One significant drawdown can break the plan.
- Respect the cycle. Bear markets are part of investing. But they are not harmless. Don’t buy the narrative that “you’ll always recover.” That’s true for the index over decades. It’s not always true for you. Your time horizon is finite. Your goals are tangible. Respect that.
Don’t let the numbers fool you. A 20 % loss is not a bump in the road. It’s a reset. It costs you capital. It costs you time. And it drags your plan off course. The damage runs deeper than the headlines suggest.
Savvy investors don’t think in terms of percentages but rather in dollars. They think in years and goals rather than days and gains. Focusing on what matters, protecting your downside, managing risk, and preserving time keep you on track.
Bear markets will come. They always do. Your job is to survive them without losing the one thing you can’t get back: time.
“The investor’s chief problem – and even his worst enemy – is likely to be himself.” – Benjamin Graham.
More By This Author:
Bubble In AI: Echoes Of The Past, Lessons For The PresentEli Lilly And Its Competitors Pop On The Pfizer News
Promised Recession…So Where Is It?


Comments
Log in or sign up to join the conversation.