
3 Reactions, 1 Message - This Market Setup Looks Eerily Similar To The Last 2 Analogues

Image Source: Pixabay
Find out a powerful chart setup showing the key defense level before a potential breakout to 7,000 how to take advantage of using these 2 analogues.
Watch the video from the WLGC session on 7 Oct 2025 to find out the following:
- How to use this moving average line to help confirm the trend’s strength and even predict a reversal.
- How to use the volume and magnitude to judge the current momentum.
- How to anticipate the next rally in S&P 500 based on the past 2 analogues.
- How to identify signs of strength or weakness by observing volatility during recent S&P 500 price movements?
- And a lot more…
Video Length: 00:05:25
Market Environment
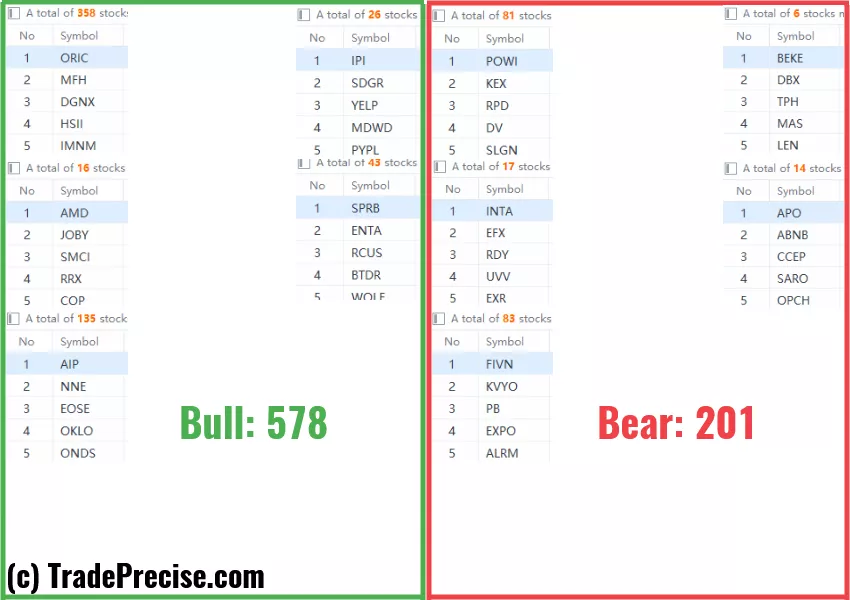
The bullish vs. bearish setup is 578 to 201 from the screenshot of my stock screener below.
(Click on image to enlarge)
3 Stocks Ready To Soar
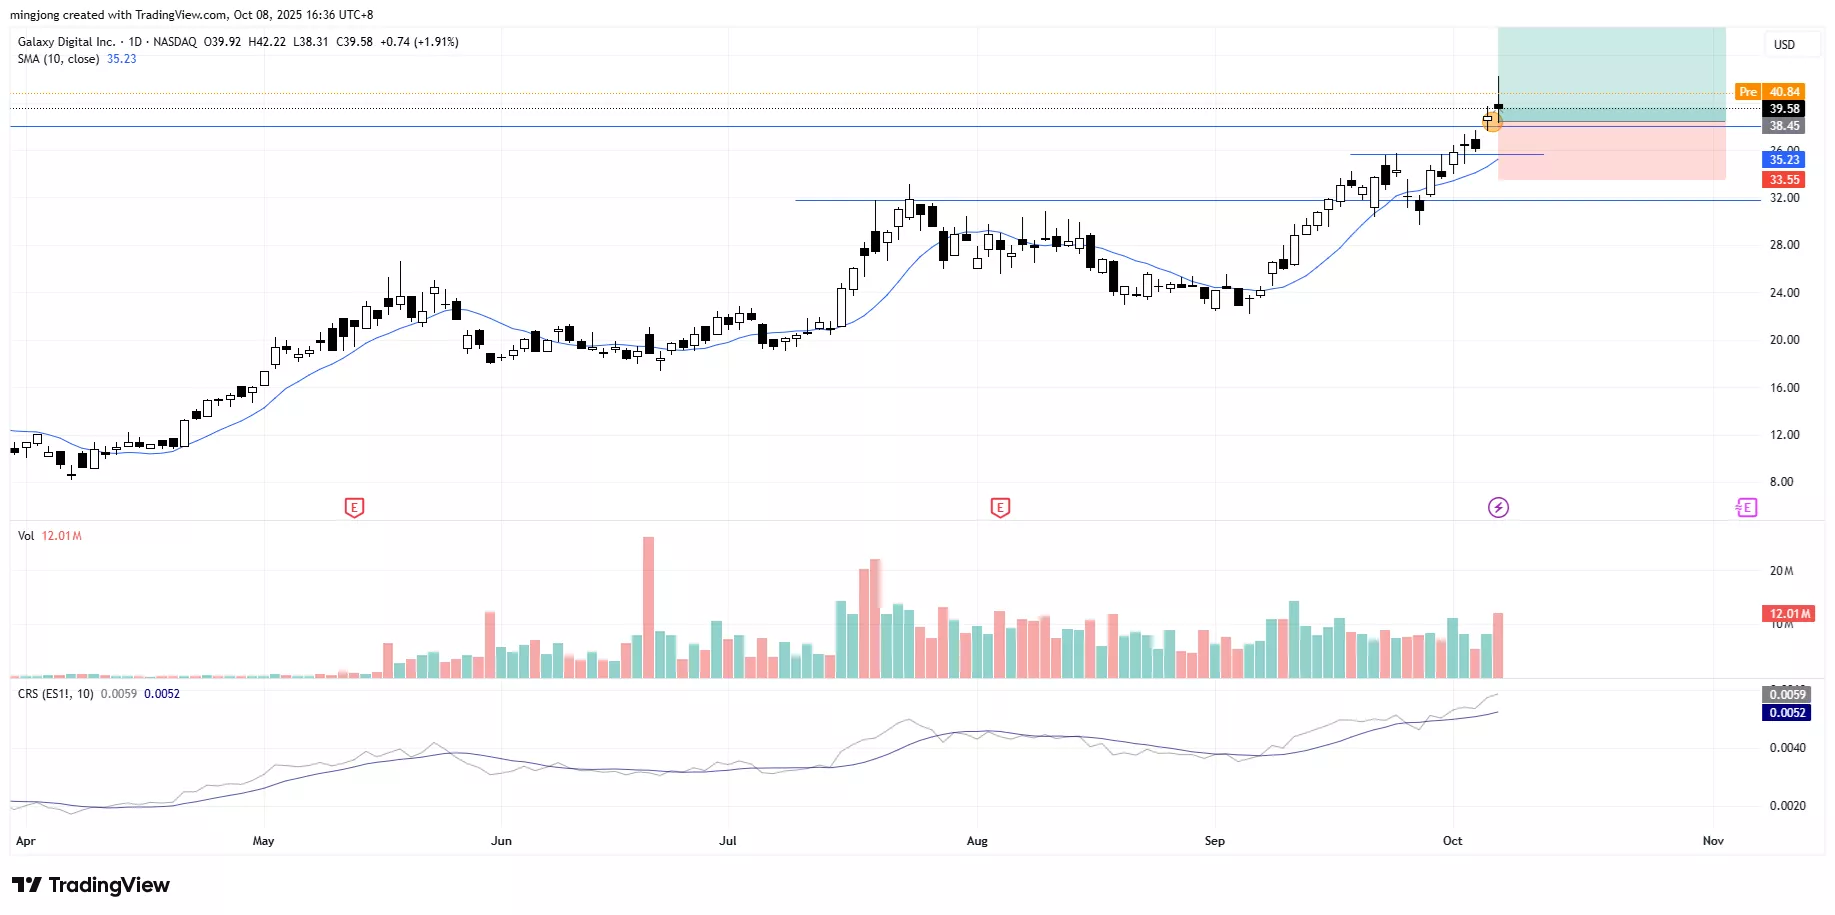
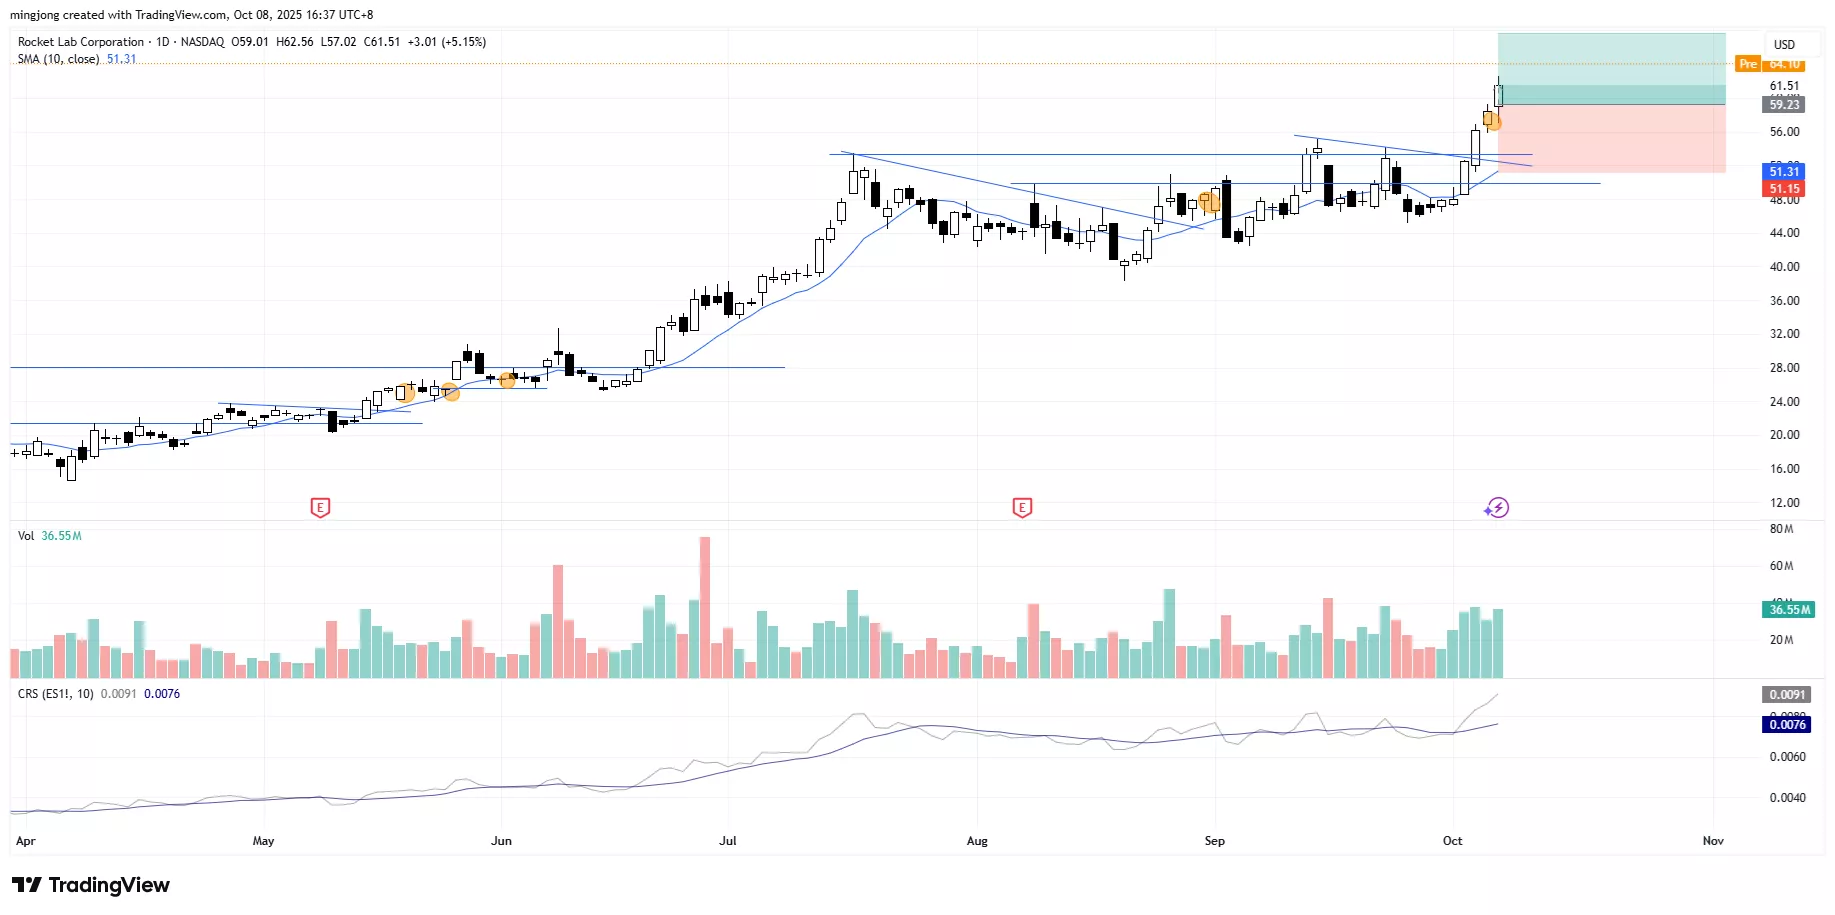
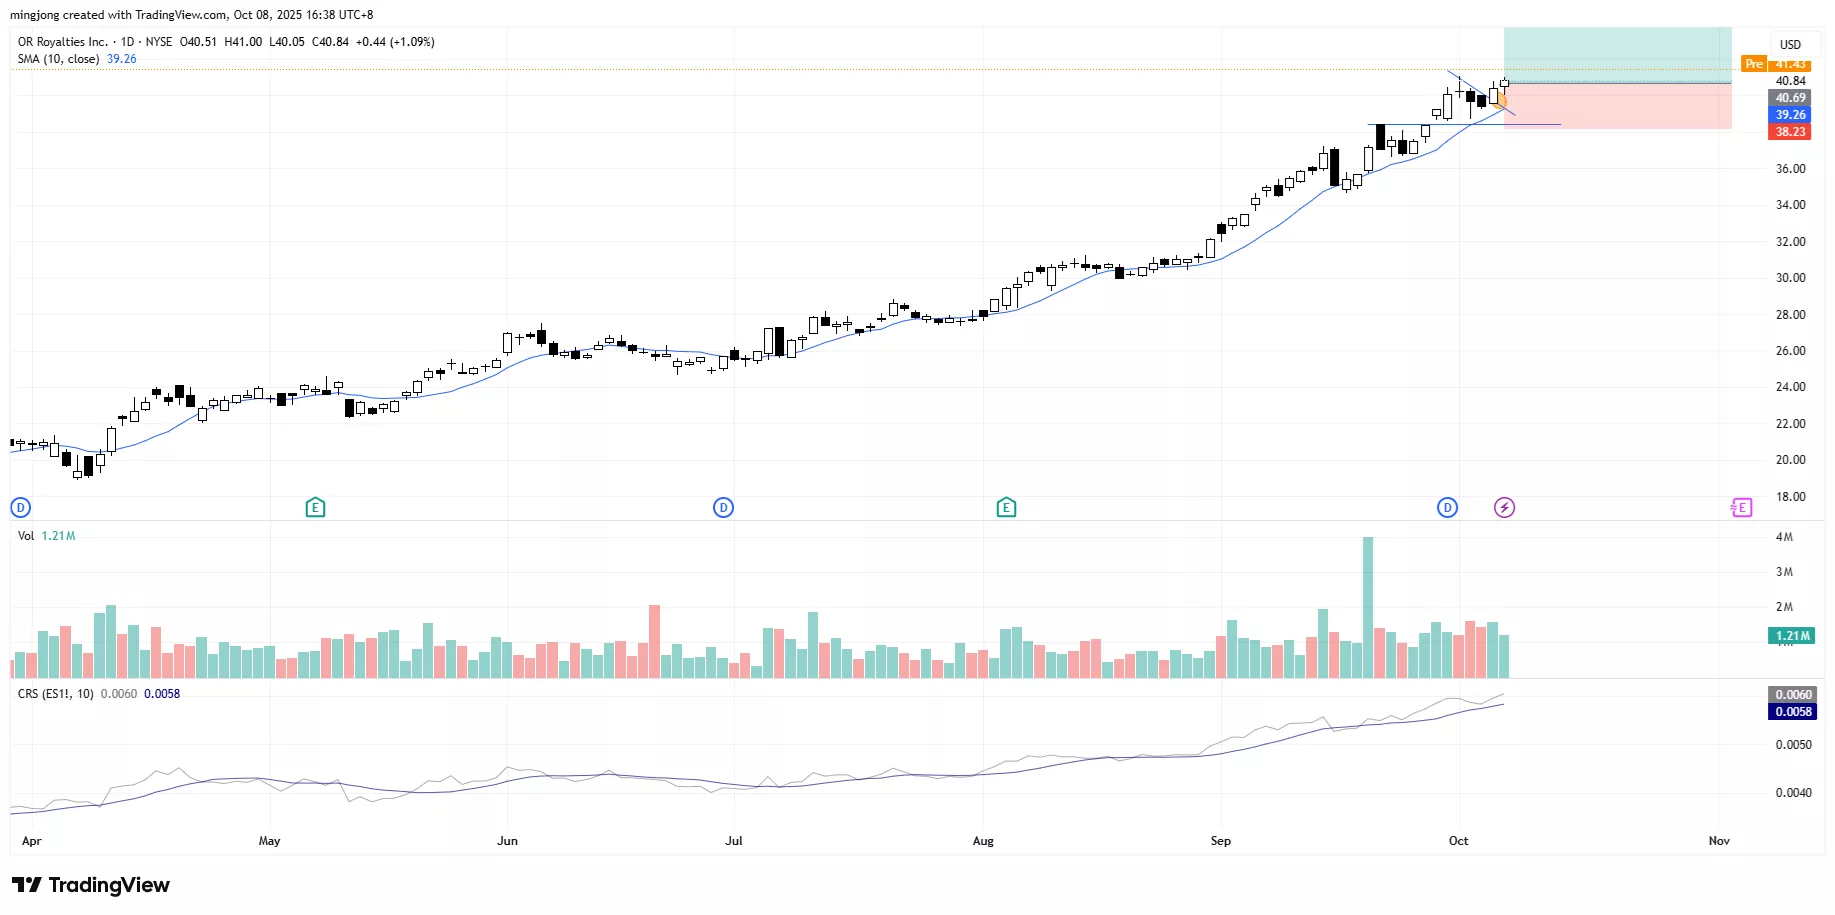
15 actionable setups such as GLXY, RKLB, OR were discussed during the live session on 7 Oct 2025 before the market open (BMO).
(Click on image to enlarge)
(Click on image to enlarge)
(Click on image to enlarge)
More By This Author:
Gap Support Tested Twice: Is The Market Quietly Building For A Year-End Rally?
The One Signal That Could Flip It
Why One ‘Momentum Bar’ Could Decide The Fate Of The S&P 500 Rally
Disclaimer: The information in this presentation is solely for educational purpose and should not be taken as investment advice.


