
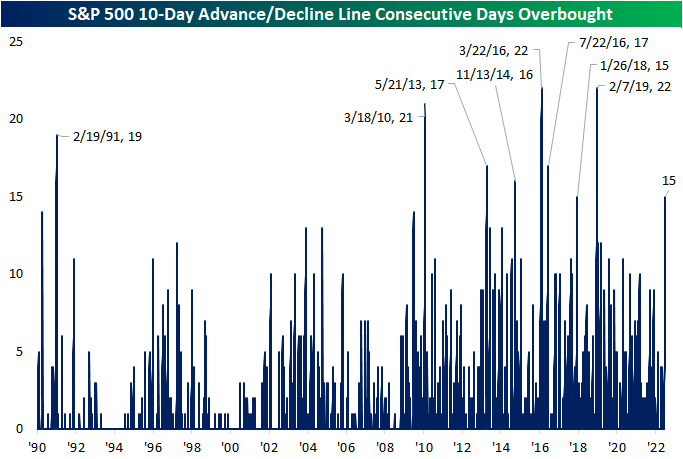
In an earlier tweet, we pointed out the elevated readings across 10-day advance-decline lines in our Sector Snapshot. Not only is the 10-Day A/D line for the S&P 500 approaching one-year highs (as of yesterday’s close), but it has been “overbought” for the last 15 trading days.

Going back to the start of our data in 1990, there have only been eight other times in which the S&P 500’s 10-day A/D line has been overbought for 15 days in a row or more. The last time such a steak was observed was at the start of 2019 which ended at 22 days. That tied for the March 2016 streak for the longest on record back to 1990. We would also note that other than one streak in the first couple of months of 1991, nearly all of these long streaks with an overbought 10-day A/D line occurred since 2010. In other words, consistently impressive breadth by this measure has largely been a recent phenomenon.
This is not the only impressive breadth signal we have covered of late. For example, in yesterday’s Chart of the Day we highlighted that more than 90% of S&P 500 stocks were above their 50-DMAs. Prior times when we’ve seen that reading spike above 90% have been followed by strong returns in the months and year ahead. Looking at the past times in which the 10-day advance-decline line has been overbought for 15 days in a row, forward performance of the S&P 500 has not been considerably stronger than the norm. From that 15th day, the S&P has risen half the time one week out. One and three-month returns are more consistently positive but weaker than the norm on a median basis. In the year after the long overbought A/D streaks listed below, though, the S&P was higher 7 of 8 times for an average gain of 11.1%.

Below is a chart of the S&P 500 since its 2009 Financial Crisis low. As shown, most of these overbought A/D line streaks have occurred as the index was recovering from some sort of sell off. Only one of them (in early 2018) came about at the time of a notable peak in the index.

More By This Author:
Moving Averages Putting Up A Fight
Housing Descending
Homebuilder Sentiment Tanks… Again


Comments
Log in or sign up to join the conversation.