
Homebuilder Sentiment Tanks… Again
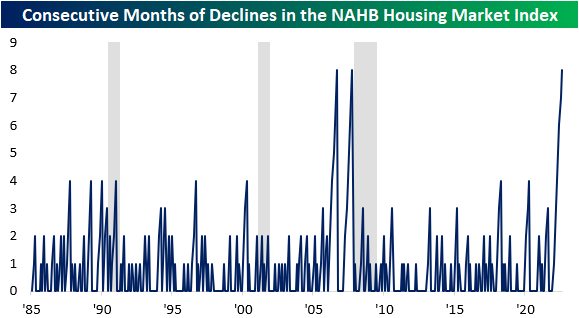
As mortgage rates remain elevated relative to 2021 levels but housing supply remains thin, NAHB’s Housing Market Index fell again this month, reaching the lowest level since May of 2020. Last month, the index posted its second-largest month-over-month decline, and following this report, the index has fallen by 18 points over the last two months, the third largest two-month decline on record, falling just short of April and May of 2020.

The NAHB Housing Market Index has now declined for eight consecutive months, which is tied for the longest monthly losing streak since the index’s inception in 1985. The only two other periods with an equal number of monthly declines were the eight months ending in October 2007 and before that September 2006. As most Americans remember, these periods were followed by precipitous declines in home values. Interestingly, the NY Post reported that Google searches for “sell my home fast” spiked by 2,750%.
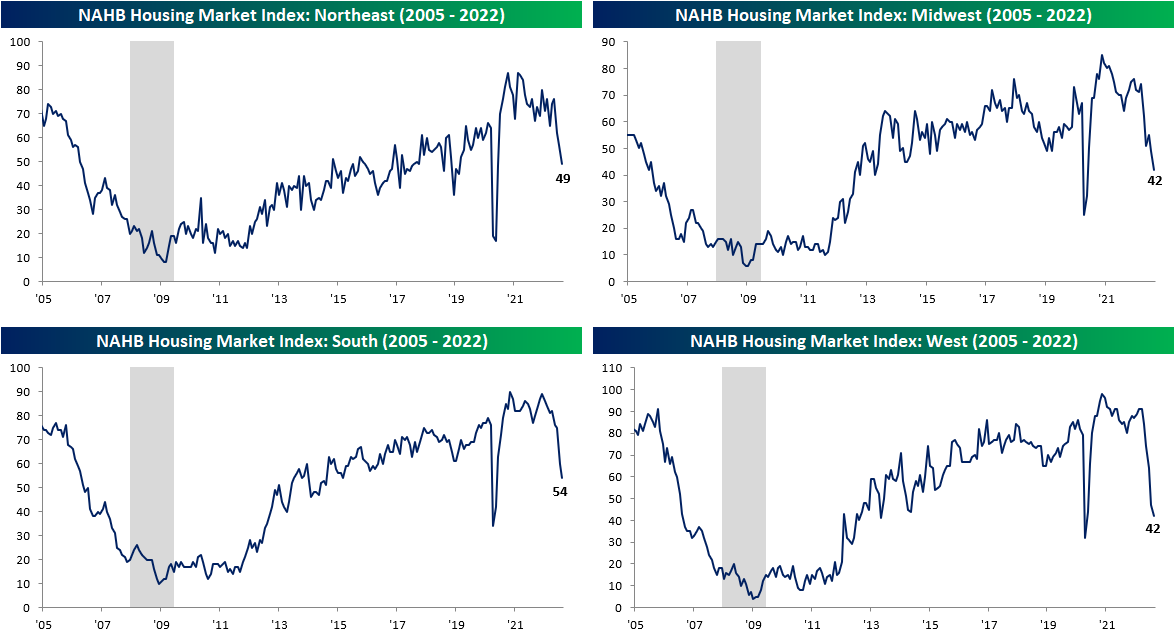
All of the sub-indices within the report fell as well, indicating broad weakness. Apart from Future Sales and sentiment in the Western region, all of the other sub-indices experienced declines that were in the bottom 5th percentile of all periods. However, the current readings are not nearly as negative. Future sales and traffic are in the 18th and 23rd percentile, but the Northeast is still in the 63rd percentile. Although the current readings aren’t as low as the readings leading up to previous recessions, it is difficult to be positive given the current trends.

As shown above, no geographic region has been safe from the plunge in sentiment, but the Northeast has held up better than the others. Over the last eight months, the West, South, and Midwest regions have seen their largest eight-month declines in the index on record, while the decline in the Northeast is the third worst on record.
(Click on image to enlarge)
The stocks most affected by these trends – homebuilders – struggled during the sustained sell-off between the end of 2021 and mid-June, but have recovered by over 28% relative to the lows. However, the ETF is still down over 22% relative to the highs. The recovery might be due to the fact that much of the negativity has been priced in, historically low valuation multiples, and a pullback in interest rates. The chart below shows the performance of the SPDR S&P Homebuilders ETF (XHB). As you can see, XHB has broken its downtrend and has been moving consistently higher carving out what might be a new uptrend.

More By This Author:
Risk Of Default DecliningFour In A Row?
Normalizing Sentiment


