

GameStop by rblfmr via Shutterstock
GameStop Corp. (GME) reported strong free cash flow (FCF) results on Tuesday, Sept. 9, for its quarter ending Aug. 2. The stock looks deeply undervalued as a result. Analysts still don't cover it, but my Sum-of-the-Parts (SOTP) assessment is over $31 per share.
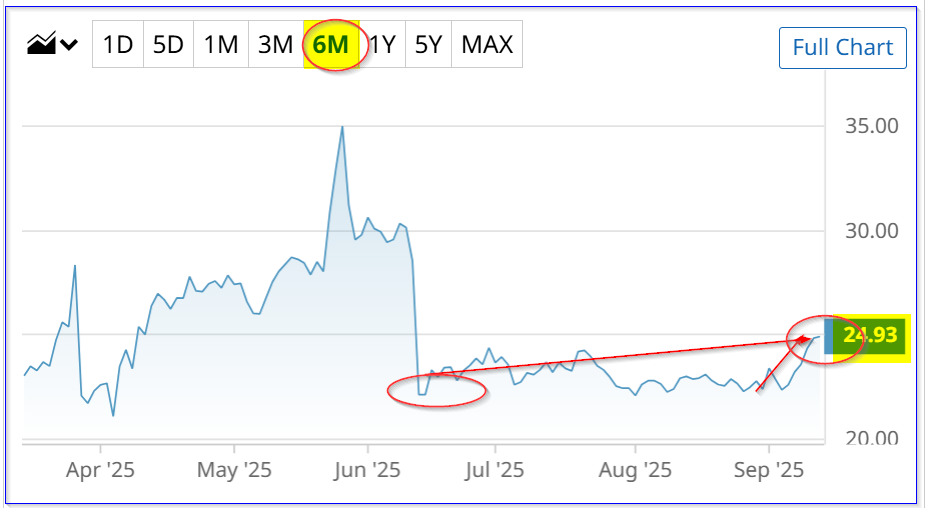
GameStop closed at $24.93 on Friday, Sept. 12, up from $22.94 before the results release, and up from a recent trough of $22.14 on June 12.
(Click on image to enlarge)
Image Source: Barchart - GameStop stock over the last six months - As of Sept. 12, 2025
But, based on its revenue and free cash flow (FCF) performance on Sept. 9 (as well as its strong balance sheet), GameStop stock could have considerable upside. This article will show why.
Strong Revenue Growth
GameStop reported that fiscal Q2 net revenue rose +21.78% year-over-year from $798.3 million last year to $972.2 million. This was in spite of the fact that GameStop now has significantly fewer stores open than a year ago.
For example, last quarter it sold all its stores in Canada, including its e-commerce business there. That represented 4.7% of its Q2 2024 sales. It is also set to divest its French stores. GameStop closed 590 stores in 2024, and it said in the latest 10-Q filing, “we anticipate closing a significant number of additional stores in fiscal 2025.”
So, to see sales rise over 21%, despite these closures, is impressive. It implies that the remaining stores, on a like-for-like basis, are doing exceedingly well. Curiously, the company does not report its “same-store” sales revenue, but just total revenue.
That might imply that investors can continue to anticipate revenue increases, as apparently, store sales and e-commerce are becoming more efficient at GameStop.
This is apparent, by the way, as Q2 sales exceeded analysts' expectations. Seeking Alpha reports that the revenue “beat” was $148.96 million (i.e., analysts were only expecting $823.24 million). That implies a huge revenue surprise of +18%.
However, only 1 or 2 analysts are covering GameStop stock, so it is not widely followed by Wall Street. This may begin to change if the company's revenue continues to gain momentum.
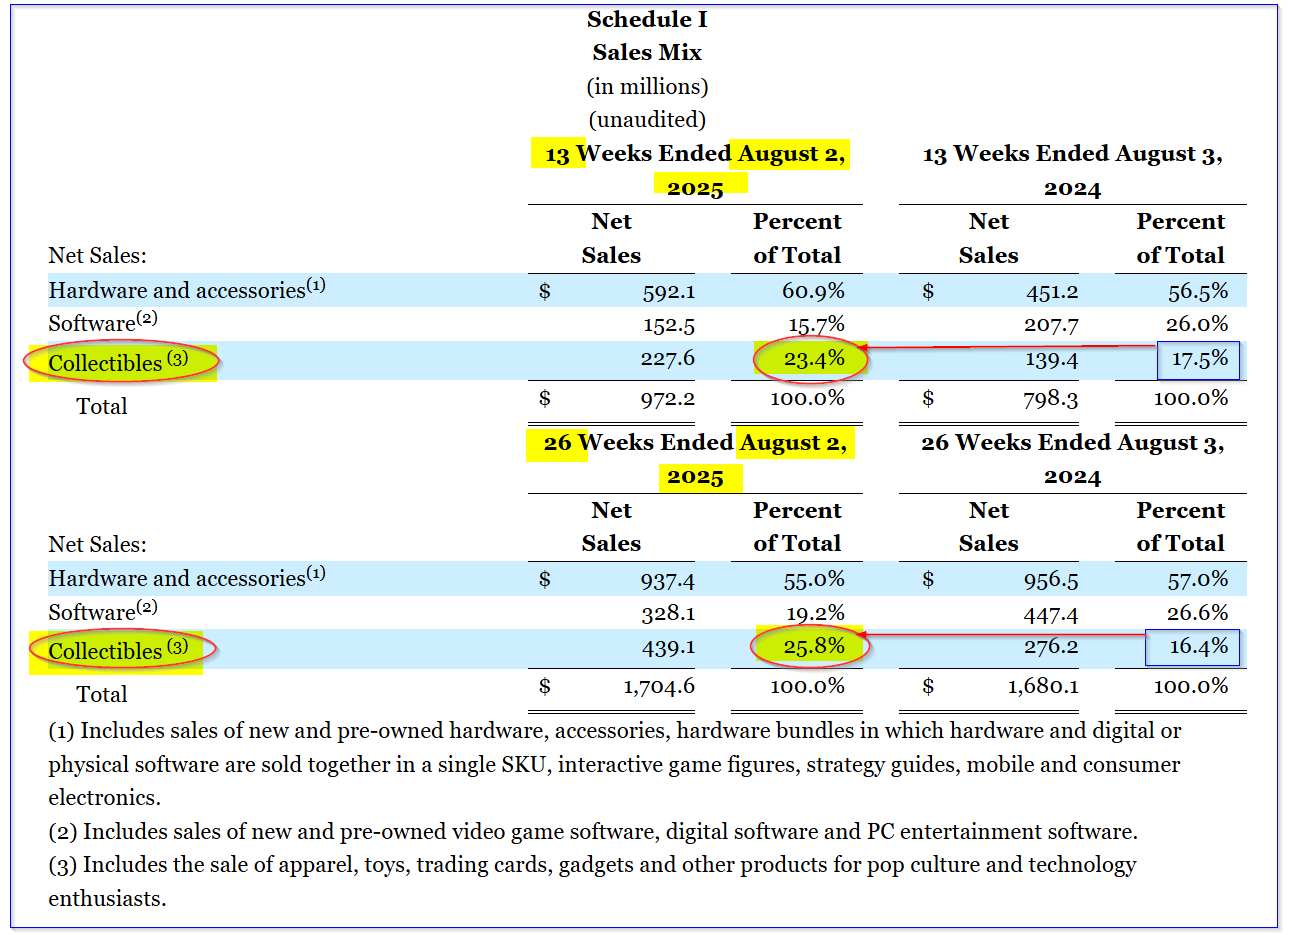
One area that stands out, for example, is that its sales mix now includes significantly higher “collectibles” sales. This can be seen in the Schedule 1 table that the company provided.
(Click on image to enlarge)
Image Source: GameStop - sales mix for the 13 weeks and 26 weeks ending Aug. 2, 2025
It shows that collectibles, including Pokémon trading cards, now account for over one-quarter of sales for the half-year results, up from 16.4% a year ago. This type of net sales is much more profitable. GameStop does not break down its gross margin mix.
However, management wrote on page 23 of the 10-Q that the higher hardware sales in Q2 2025 vs. last year led to a lower gross margin (29.1% this quarter vs. 31.2% last year). This was because new hardware sales have a lower gross margin than collectibles and pre-owned hardware and accessories.
The point is that as collectible sales grow strongly, its gross and operating margins will increase as well.
Strong Free Cash Flow (FCF)
Despite the strong contribution from its huge cash pile, the underlying business also had strong free cash flow (FCF) growth. I talked about this in my last article on GameStop on June 15.
For example, on Sept. 9, GameStop reported that its operating cash flow (OCF) was $117.4 million. After deducting $4.1 million in capex, its FCF was $113.3 million, up from $65.5 million FCF a year ago (i.e., +73.8% year-over-year).
Now, after deducting $79.6 million interest (from the income statement), its Q2 2025 FCF from operations was $33.7 million, vs. $26.0 million a year ago (i.e., $65.5 million-$39.5 million interest). This means its net operating FCF rose +29.6% year-over-year, not including the extra interest income from its huge cash pile.
In other words, despite fewer stores being open, GameStop is squeezing out more cash from its operations. For example, the net FCF margin from operations is now:
- $33.7 million / $972.2 million, or 3.47%, up from 3.26% a year ago (i.e., $26.0 million/$798.3 million)
The point is, even if sales fall due to fewer stores outstanding, we can project higher FCF from GameStop's operations, not including higher cash interest from its cash pile.
For example, the two analysts who cover GameStop are projecting 12% lower sales next year at just $3.61 billion, vs. $4.16 billion this year (this is despite higher 1.45% sales so far this year in H1). That implies the next 12 months (NTM) net sales could average $3.885 billion.
If we apply a 3.47% operating FCF margin, it implies that FCF (before interest) will be $134.81 million. That is equal to 4 times its existing $33.7 million net FCF, despite lower sales being projected (if the opposite occurs, i.e., sales rise, the FCF will be higher).
The bottom line is that GameStop's cash flow is set to be at least the same, if not higher, from its operations. That makes its stores worth considerably more, as can be seen in a sum-of-the-parts (SOTP) valuation.
Sum-of-the-Parts (SOTP) Value for GameStop Stock
Discussed below is the sum-of-the-parts value for GameStop.
Stores
I recently discussed a similar company's valuation, Chewy, Inc. (CHWY), based on its FCF margins and FCF forecasts.
Chewy, Inc., recently made a 3.41% quarterly FCF margin, and over the trailing 12 months (TTM) period, its FCF margin was 3.75% I valued its business at a 2.89% FCF yield (i.e., 34.6x FCF multiple, the reciprocal of a FCF yield), based on its TTM FCF yield metric.
So, if we estimate that GameStop's stores will generate $135 million in FCF over the next 12 months, here is what the stores' revenue would be worth:
- $135 million x 34.6 = $4,590 million, or $4.59 billion
Note that this valuation is equal to 1.1x estimated sales this year ($4.16 billion). That seems a bit too low. A more reasonable valuation, given its strong FCF growth and cash accumulation debt-free (see below), is at least 2.0 times sales, or $8.320 billion:
Since there are now 447.666484 million shares outstanding (according to the 10-Q as of Sept. 5), that means the stores are worth:
- $8,320 million / 447.666484 million = $18.59 per share
Net Cash
As of Q2, GameStop had $8.6944 billion of cash on its balance sheet, equal to $19.42 per share. However, its net cash is lower, since there is $4.1609 billion in convertible debt on its balance sheet as well (note that I don't count short-term liabilities and operating leases, as these would be included in any valuation of the stores).
- $8.6944 billion cash - $4.1609 billion debt = $4.5335 billion net cash
- $4,533.5 million / 447.666484 million shares O/S = $10.13 per share
So, just including the stores and net cash, the stock is worth $28.72 per share. That leaves its Bitcoin holdings and the expected accumulation of net interest income (at no cost).
Bitcoin Assets
GameStop has not increased its stake in Bitcoin, still holding at 4,710 BTC. As of today, they are worth $115,702.89 per BTC:
- $115,702.89 x 4,710 = $544.96 million, or $1.217 per share
That is up 8.99% from a $500 million cost, but this gain is automatically included in the SOTP analysis. So, before including any value accruing to GameStop from expected interest income, the SOTP value of GameStop stock is $21.597, or $29.94 per share.
Interest Accumulation
GameStop is making about 4% annually on its interest income. For example, last quarter, its interest income was between $80 million and $95.0 million on between $8.694 billion and $8.565.8 billion (the latter not including FCF contributions). That works out to about 1.0% during the quarter on the $8.6944 billion figure, or 4.0% annualized.
Note, I calculated the $95 million in interest this way: $6.3858 billion in Q1 cash May 3, plus $2.68 billion (from selling an upsized amount of senior convertible notes due 2032) received on June 17. That equals $9.0658 billion, less $500 million paid for BTC assets, or a net cash amount of $8.5658 billion. Therefore, the net cash accumulated during the quarter was:
- $8.6944 billion - $8.5658 billion as of June 17 = +$128.6 million Q2 cash growth
I estimate that, after deducting $33.7 million in FCF (see above), the interest income accumulation for the quarter was about $94.9 million. However, that was higher than the $79.6 million in interest income from the income statement, and the difference could be due to net changes in working capital or costs from the convertible sales.
So, for example, if the company averaged about $8.65 billion in net cash during the quarter and its interest income was $85 million, its net interest rate was about 1.0%.
We can use that to estimate its next 12 months (NTM) interest accumulation. For example, on a balance of $8.7 billion in cash, 4.0% equals $348 million. But also, the operations are generating about $135 million in FCF. So, the total accumulation of cash will be $483 million over the next 12 months:
- $483 million / $447.666484 million shares = $1.08 per share
That means the total SOTP value is $31.02 per share. That is +24.4% more than GameStop's present stock price. The bottom line is that GameStop stock looks undervalued here. As its FCF continues to grow, the market may end up valuing it higher.
Shorting OTM Puts
One way to play this is to sell short out-of-the-money (OTM) put options in near-term expiry periods. That way, an investor can make extra income while waiting for the stock to fall.
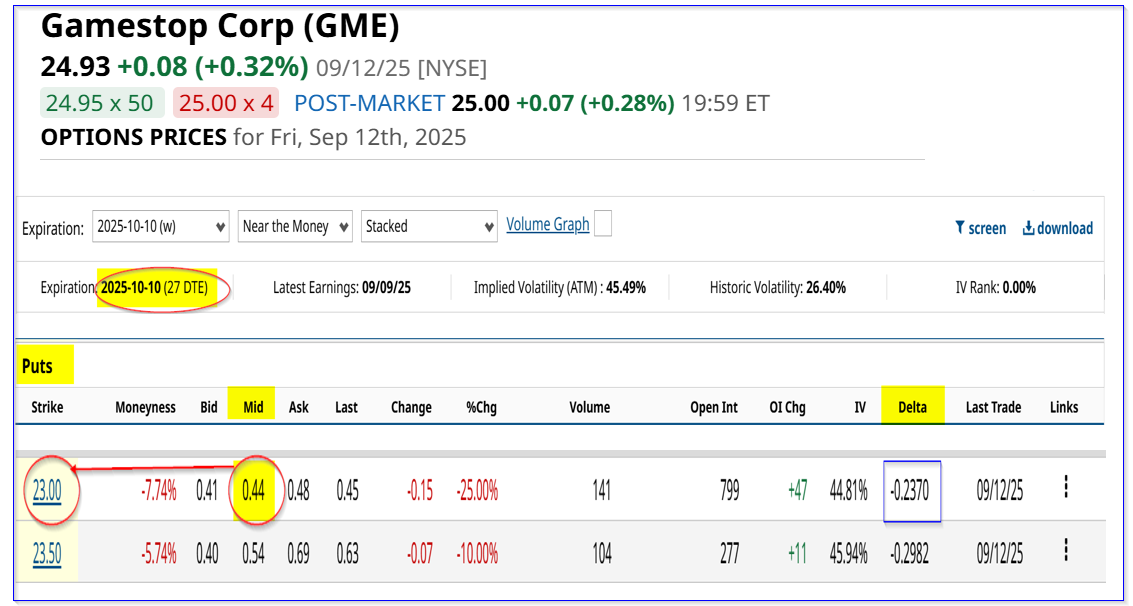
For example, the $23.00 put option contract expiring Oct. 10 has a midpoint premium of $0.44. That means an investor who enters an order to “Sell to Open” this contract can make an immediate yield of 1.91% over the next 27 days to expiry (DTE).
(Click on image to enlarge)
Image Source: Barchart - GameStop puts expiring Oct. 10 - As of Sept. 12, 2025
The investor must first secure $2,300 in cash or buying power with their brokerage firm to act as collateral to buy 100 shares at $23.00. That then leads to an immediate income of $44.00 in the account.
As a result, the net breakeven point is $23.00 - $0.44, or $22.56. That is 9.5% below Friday's close, and provides an attractive potential entry buy-in price for an investor.
For example, if GameStop eventually reaches $31.00, the upside potential is +37.4% (i.e., $31.00/$22.56 -1). Moreover, if an investor can repeat this 1.91% short-put yield over the next three months, the expected return (ER) would be 5.73%, an annualized +22.92%.
The bottom line here is that GameStop stock is undervalued on an SOTP basis, and shorting OTM puts is one attractive way to play this.
More By This Author:
Chewy Stock Is Down After Strong FCF Results - CHWY Is Worth 15%+ More
Microsoft Stock Is Off Its Highs, But Target Prices For MSFT Are Higher
Is Bitcoin Set To Rebound? Ways To Play A BTC Cryptocurrency Turnaround

Comments
Log in or sign up to join the conversation.