
by- Bing-Jhen Hong via iStock
Costco Wholesale Corp. (COST) reported strong free cash flow (FCF) and FCF margins on Dec. 11. However, COST stock has tumbled, down 8.7% over the last year. That makes COST stock attractive to value investors and could be a bargain here.
COST closed at $873.35 on Friday, Dec. 26, 2025. That's up from a closing price trough of $850.00 on December 22, but still down 8.66% from $956.14 a year ago on December 24, 2024, and is off 4.68% YTD ($916.27 on December 31, 2024). This does not make sense.
(Click on image to enlarge)
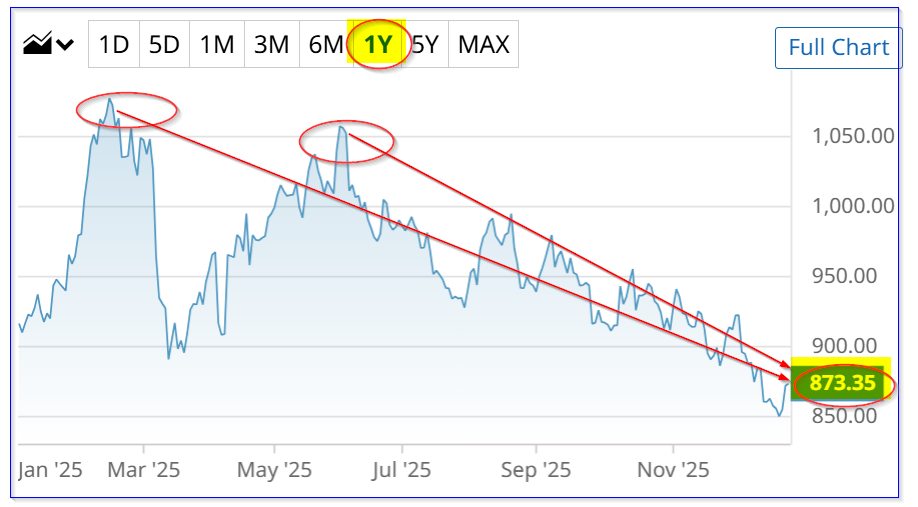
COST stock - last 12 months - Barchart - Dec. 26, 2025
Costco's strong outlook makes COST stock look even more valuable. This article will show that it could be worth 18% more at almost $1,032 per share.
Strong Free Cash Flow and FCF Margins
On Dec. 11, Costco Wholesale Corp. reported that its fiscal Q1 revenue ending Nov. 23, 2025, rose 8.28% and was up 6.4% on a comparable (i.e., same-store) basis.
Moreover, its free cash flow (FCF) surged 58.4% YoY according to Stock Analysis, to $3.162 billion, compared to $1.996 billion in last year's Q1. Moreover, over the last year, FCF is up over 79% to just over $9 billion, from just over $5 billion last year.
Based on that alone, COST stock should be much higher, not lower.
But look at its FCF margins. Stock Analysis reports that its Q1 2026 FCF margin was 4.70%, compared to 3.21% a year ago. That's a 46% improvement in Costco's ability to squeeze out more cash from its operations.
In addition, over the trailing 12 months (TTM), its FCF margin was 3.21% of sales, compared to 2.85% in its TTM FCF margins in FY 2025. That's another 12.6% improvement over FY 2025.
In other words, with higher sales, the company can increase its FCF margins. That's an indication of strong operating leverage and good management.
Moreover, it means we can forecast higher FCF over the next 12 months (NTM).
Forecasting FCF
For example, analysts now project that sales this fiscal year ending Aug. 31, 2026, will be $297.14 billion, up +8% from $275.2 billion for the year ending Aug. 31, 2025. Moreover, for the year to Aug. 31, 2027, analysts project $318.18 billion.
So, for the next 12 months (NTM) period (using 3/4ths of the FY 2026 period and ¼ of the FY 2027 period, we can project $302.65 billion in NTM sales. That's 10% over FY 2025.
So, as a result, let's apply an FCF margin to project FCF for the NTM period. Moreover, we can assume that the FCF margin will be higher than the TTM FCF margin.
For example, if we assume that its 3.21% FCF margin rises by 10%, we can use a 3.53% FCF margin (remember its TTM rose 12.6% in the latest quarter):
$302.65 billion NTM sales x .0353 = $10.68 billion NTM FCF
That is +36.3% higher than the $7.837 billion in FCF Costco generated in FY 2025 and +18.7% over its $9 billion TTM figure as of Nov. 23, 2025.
That could easily imply that Costco stock should be worth considerably more. Let's look at this.
Costco's Value and Price Targets (PT)
FCF -Based PT. Costco pays out just 25% of its FCF in dividends. Moreover, COST stock has a paltry dividend yield, just 0.60% (i.e., $5.20 / $873.35).
That seems to imply that if Costco were to pay out 100% of its FCF, the dividend yield would be 4 x higher (i.e., 1/0.25 = 4), or 2.40%.
As a result, let's use its projected FCF to determine a new dividend payment:
$10.68 billion NTM FCF / 0.024 = $445 billion market value
That is +15% higher than its present market cap of $387 billion, according to Yahoo! Finance.
However, consider this. Costco's TTM $9 billion in FCF represents 2.32% of its $387 billion market cap. That would give the stock a $460 billion mkt value:
$10.68 / 0.0232 = $460 billion mkt cap
This is +18.9% higher than its present mkt cap. That implies a target price (TP) over $1038 per share:
$873.35 x 1.189 = $1,038.41 Price Target (POT)
Dividend Yield PT: This is similar to a PT using its dividend yield.
For example, based on its historical dividend payout ratio of 25% of FCF, the NTM dividend could rise by 18.9%:
$10.68 billion NTM FCF x 0.25 = $2.6625 billion dividends NTM.
$2.6625b / $2.245 billion TTM dividends (Stock Analysis) = 1.186
1.186 -1 =+18.6% increase in expected dividends
Therefore, if Costco were to hike its DPS by 18.6% from $5.20 to $6.17 per share, using its average dividend yield of 0.6%, COST stock will be:
$6.17 / 0.006 = $1,028 PT
That is 17.7% higher.
Analyst PTs: Analysts tend to agree. For example, Yahoo! Finance shows that 36 analysts have an average PT of $1,031.45. Barchart's mean survey shows $1,048.31 and AnaChart's survey is $947.26 per share.
So, analyst surveys show an average PT of $1009 per share, or +15.5% higher.
Summary and Conclusion
Based on these three methods, COST stock is likely worth almost $1,032 per share:
FCF Yield ……….. $1,038 PT
Div Yield ………… $1,048 PT
Analysts …………. $1,009 PT
Average PT …….. $1,031.67
Upside ……………. +18% higher
The bottom line is that COST stock looks too cheap here. That's why it's so attractive to value investors.
In my next Barchart article on Monday, Dec. 29, I will show several leveraged ways to play this using out-of-the-money (OTM) puts and in-the-money (ITM) calls.
More By This Author:
Cisco Systems Stock Is Treading Water - How To Use Puts And Calls To Play CSCO
Super Micro Computer Stock Tumbles, But Investors Are Piling Into Its Call Options - Time To Buy SMCI?
Occidental Petroleum Stock Has Tanked - But It May Hike Its Dividend - Time To Buy?

Comments
Log in or sign up to join the conversation.