
Messages From The (Bond) Market
Today, the CEA published a blog post on how the administration’s infrastructure and Build Back Better plans won’t be inflationary. I think it’s of interest to see how the market (which will undoubtedly turn out to be wrong) thinks inflation and output will evolve.
For medium-term inflation expectations, I look to the five-year inflation breakeven, and the expected inflation over the next five years as inferred using the breakeven and additional survey and market information.
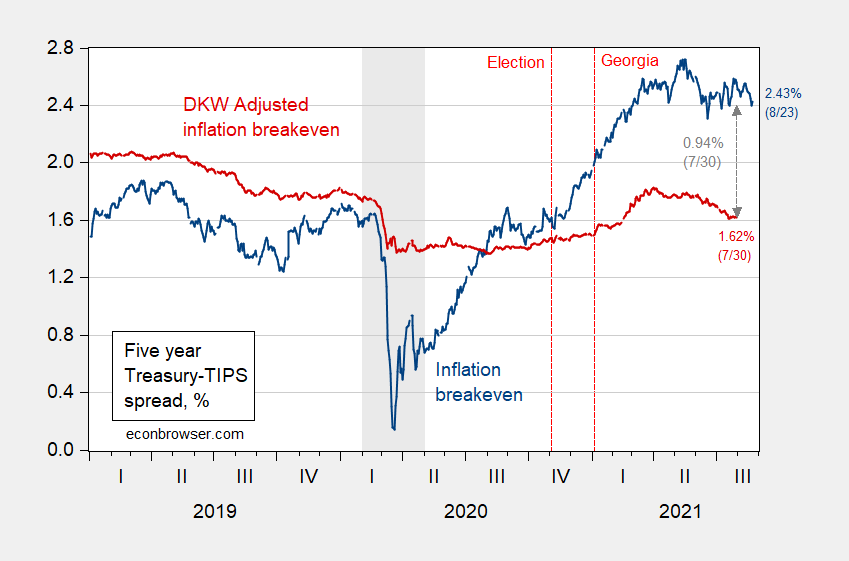
Figure 1: Five-year inflation breakeven calculated as five-year Treasury yield minus five-year TIPS yield (blue), five-year breakeven adjusted by inflation risk premium and liquidity premium per DKW (red), all in %. NBER defined recession dates shaded gray (from beginning of peak month to end of trough month). Source: FRB via FRED, Treasury, KWW following D’amico, Kim, and Wei (DKW) accessed 8/5, NBER and author’s calculations.
The implied inflation rate from the simple breakeven calculation is the same as it was around 6/9/2021, for the last two and a half months.
In part, the moderation in expected inflation over the past five months is due to an anticipated deceleration in growth, as implied by the term spread.
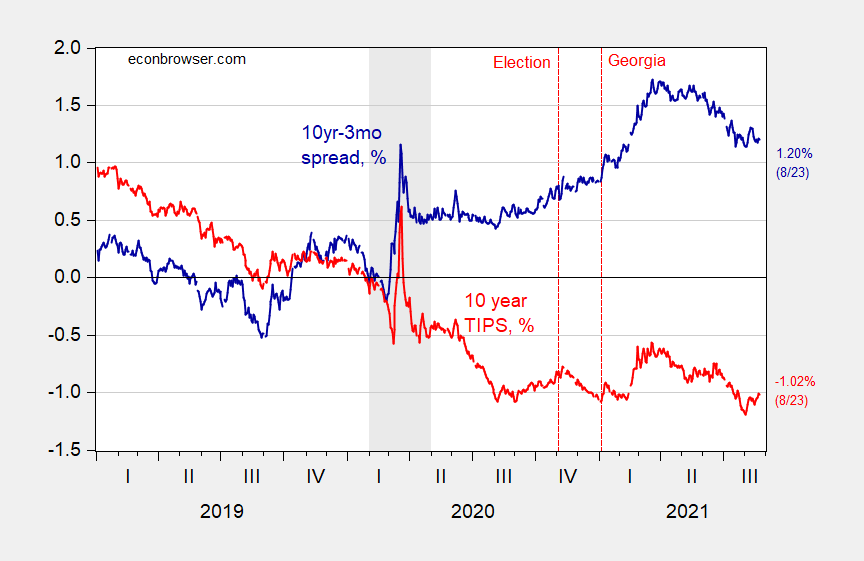
Figure 2: Ten-year three-month Treasury spread (blue), and ten-year TIPS yield (red), both in %. NBER defined recession dates shaded gray. Source: Treasury, NBER, and author’s calculations.
Admittedly, the link between the term spread and growth (as well as recessions) is loose, but the implication of marked-down anticipated growth is buttressed by the decline in the real rate as measured by the TIPS 10 year yield.
To me, this is suggestive of a continuing decline in inflation anxieties, and rising worries over the pace of recovery (see also this post).
Disclosure: None.


