
Market Inflation Expectations And Real Rates
Is the inflation scare bubble over?
As of yesterday, the five year inflation breakeven was 2.5%, down from 2.72% in mid-May. The estimated inflation risk and liquidity premia adjusted 5 year breakeven was 1.62% as of 7/30 (when the corresponding actual breakeven was 2.56%).
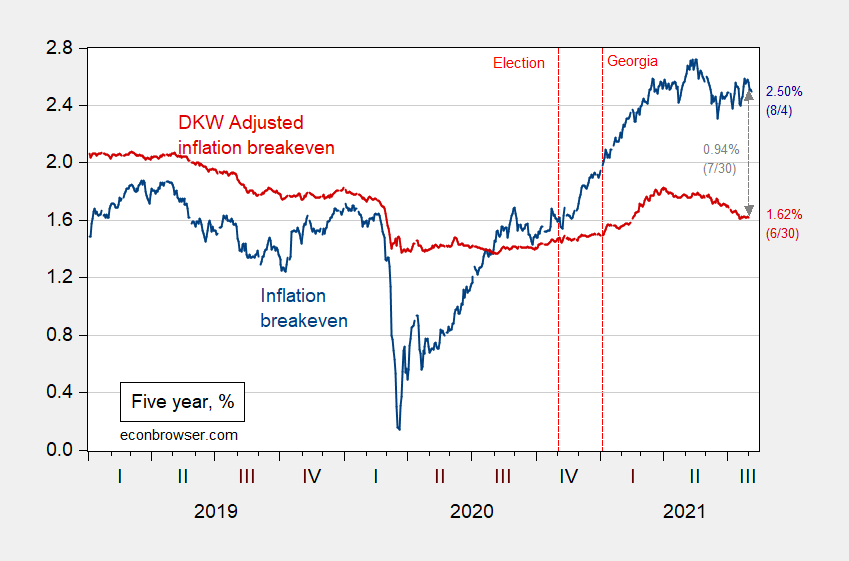
Figure 1: Five year inflation breakeven calculated as five year Treasury yield minus five year TIPS yield (blue), five year breakeven adjusted by inflation risk premium and liquidity premium per DKW (red), all in %. NBER defined recession dates shaded gray (from beginning of peak month to end of trough month). Source: FRB via FRED, Treasury, KWW following D’amico, Kim and Wei (DKW) accessed 8/5, NBER and author’s calculations.
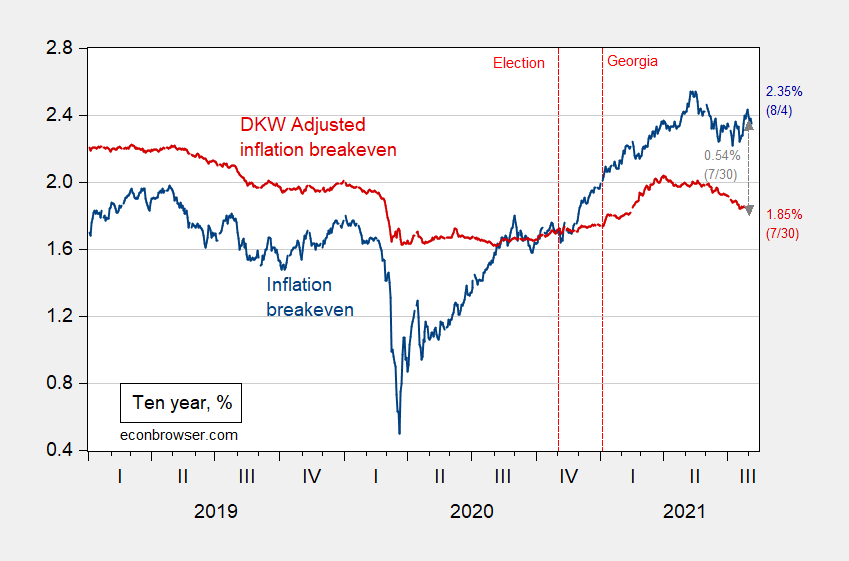
Figure 2: Ten year inflation breakeven calculated as ten year Treasury yield minus ten year TIPS yield (blue), ten year breakeven adjusted by inflation risk premium and liquidity premium per DKW (red), all in %. NBER defined recession dates shaded gray (from beginning of peak month to end of trough month). Source: FRB via FRED, Treasury, KWW following D’amico, Kim and Wei (DKW) accessed 8/5, NBER and author’s calculations.
As Gagnon and Sarsenbayev noted earlier this year, market-based expectations of inflation have not been particularly good at predicting actual inflation. I concur, as discussed in this post, but I think measures purged of extreme events related to liquidity premia are probably slightly better at prediction.
That being said, medium term inflation expectations are what matters for the position of the Phillips curve, as discussed in this post.
Even if the market has rational expectations (in equilibrium – sometimes that’s called FIRE), that only means it’s correct on average. What’s true is the “internet”‘s interest has waned.
(Click on image to enlarge)
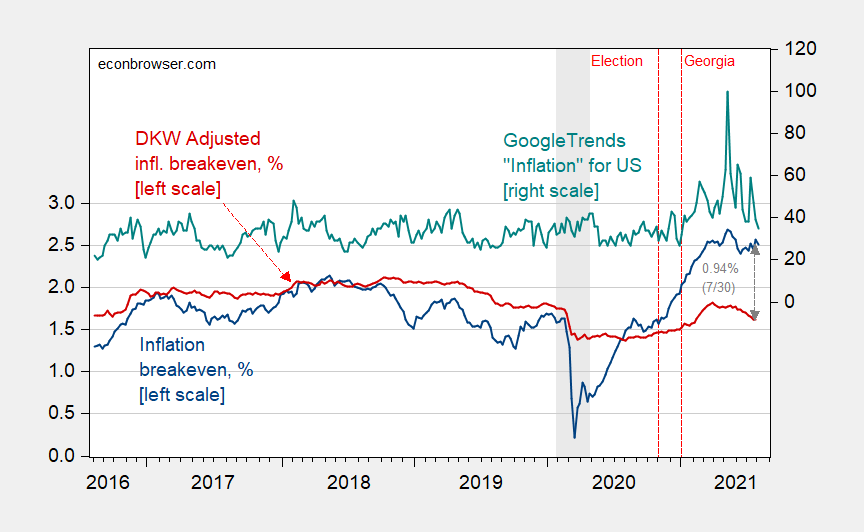
Figure 3: Five year inflation breakeven calculated as five year Treasury yield minus five year TIPS yield (blue), five year breakeven adjusted by inflation risk premium and liquidity premium per DKW (red), all in %, and Google Trends search index for “Inflation” in US. NBER defined recession dates shaded gray (from beginning of peak month to end of trough month). Daily Treasury data averaged to weekly. Source: FRB via FRED, Treasury, KWW following D’amico, Kim and Wei (DKW) accessed 8/5, NBER and author’s calculations.
Finally, I think concerns of aggregate demand shifting far into high gear (which is separate from aggregate demand far exceeding potential GDP) are abating. Both 5 and 10-year TIPS yields are near record lows.
(Click on image to enlarge)
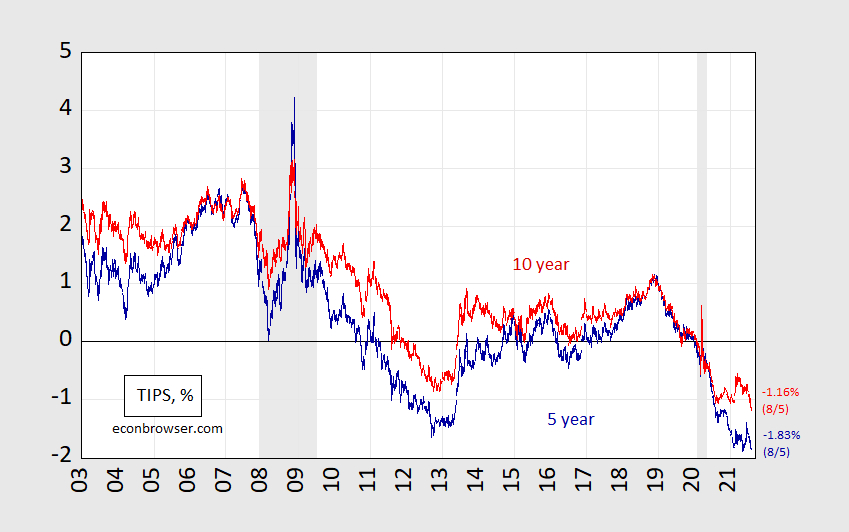
Figure 4: Five year TIPS yield (dark blue), five year TIPS yield (light red), all in %. NBER defined recession dates shaded gray (from beginning of peak month to end of trough month). Source: FRB via FRED, Treasury, NBER and author’s calculations.
Admittedly, these calculations don’t account for liquidity premia on TIPS. Five year expected average short rates are off recent lows but are still below zero at -0.45% (vs. -1.87%, both on 7/30).
Disclosure: None.


