

I think of this graph as the most important graph for thinking about sustained AI-related Capex spending:
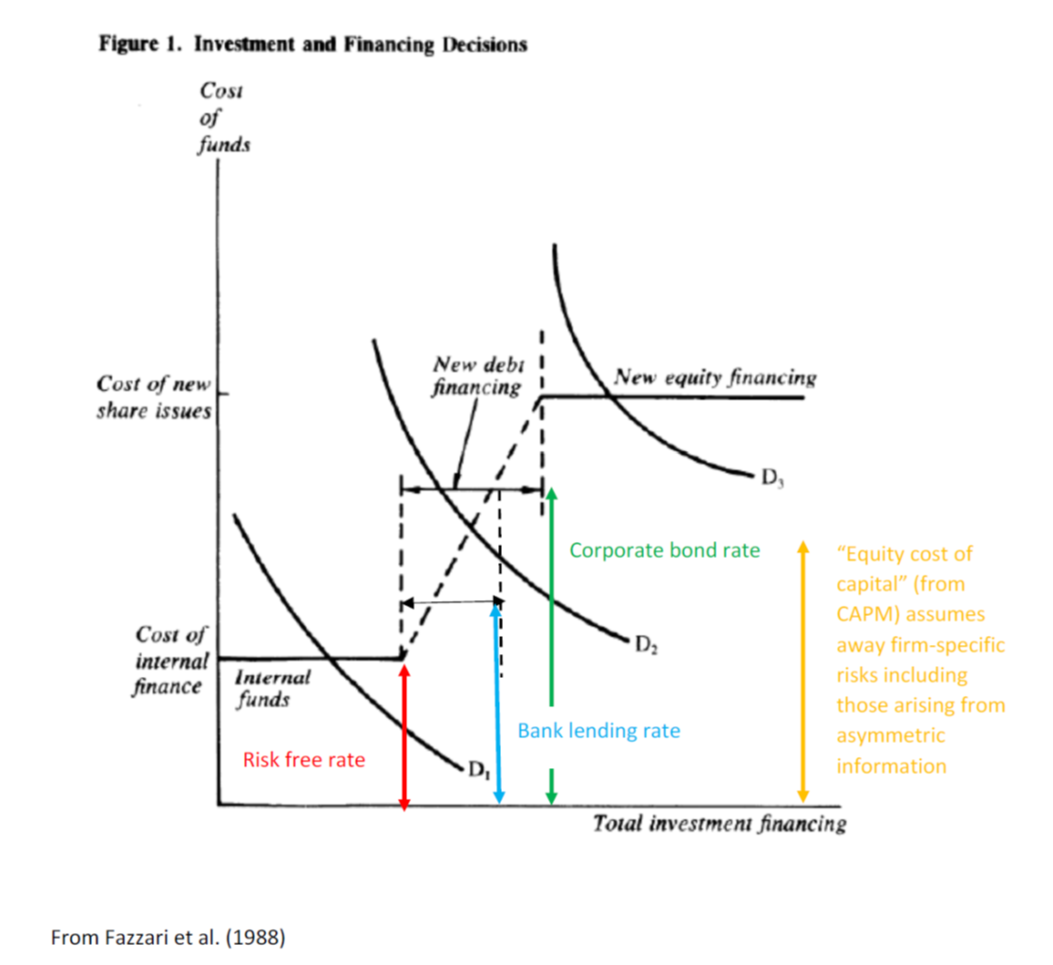
Source: Fazzari et al. (1988) as modified by Chinn.
The lowest flat portion represents financing cost out of cash flow. Until now, the demand curve intersected on this portion of the financing supply curve.
Starting in 2026, hyperscalers are relying on external financing (while other AI related firms without cash flow have been tapping external finance for months). Now, the demand curve is shifting outward.
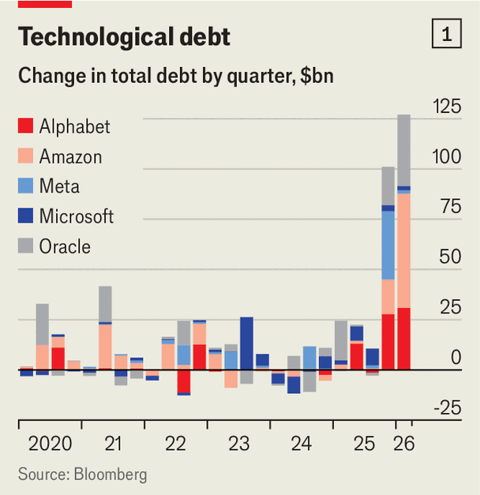
Source: Economist.
Going forward, free cash flow is projected to rise starting in 2028 — but that’s a projection.
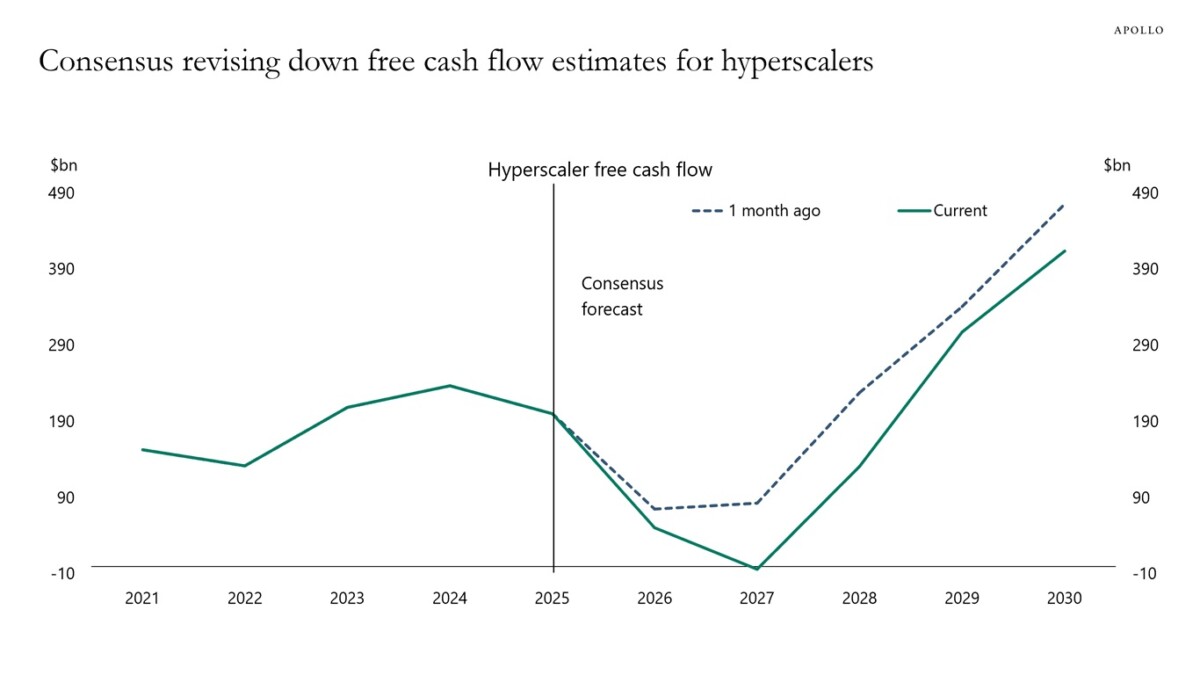
Source: Slok (July 28, 2026).
For context, here’re the plans for capex spending for four hyperscalers.
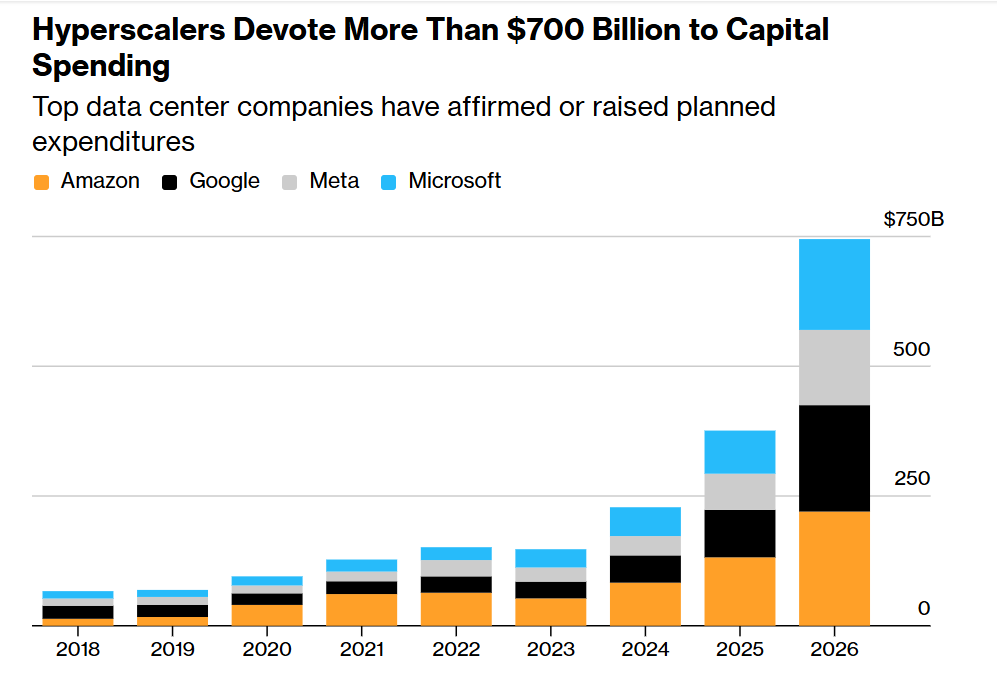
Source: Bloomberg (July 30, 2026).
Returning to the pecking order graph (Figure 1), note that a rise in the corporate bond rate pertaining to these hyperscalers will reduce the quantity of finance demand…When the hyperscalers could rely on internal funds, they were largely insulated from the effect of rising bond yields. This might not be so true going forward.
Comments
Log in or sign up to join the conversation.