
Meme Markets: Investing Vs. Entertainment

Image Source: Unsplash
Market Brief – August Defies Seasonal Weakness
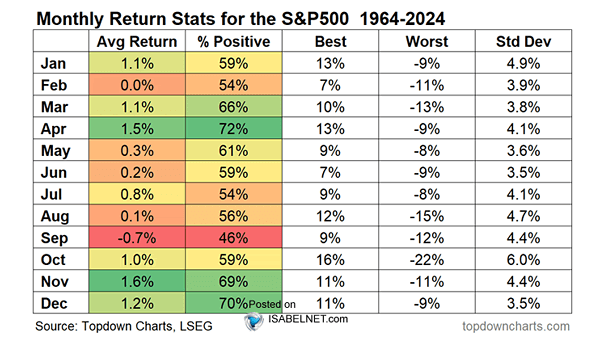
August turned out to be anything but typical for investors. Historically, the month is plagued by seasonal weakness, thinner liquidity, and heightened volatility as traders position ahead of September and Q3 earnings. Over the last 30 years, August has delivered some of the poorest monthly returns on average for the S&P 500. Yet in 2025, the index defied that history, grinding higher through the month and setting new intraday records above 6,500 before finishing at 6,452. The result was a modest gain for the month, but more importantly, it marked another milestone in an already extended rally.
Several key drivers helped markets overcome the seasonal drag. First, enthusiasm for artificial intelligence and related infrastructure remained a powerful tailwind. While semiconductor stocks wobbled late in the month, the earnings season still underscored the scale of corporate spending on AI capacity, which fueled flows into mega-cap leaders. Second, economic data leaned just supportive enough to keep the “soft-landing” narrative alive. A revised 3.3% GDP growth rate, steady jobless claims, and consumer spending that grew faster than income all suggested the U.S. economy continues to avoid recession. At the same time, July’s PCE inflation data cooled modestly, giving investors more confidence that the Federal Reserve could begin easing policy as soon as September. Third, global conditions, falling yields overseas, a softer U.S. dollar, and relatively calm energy markets, reinforced the idea that liquidity would remain abundant despite tariffs and trade disruptions.
The question is whether that resilience can hold in September, historically the weakest month of the year for equities. Valuations are stretched, breadth remains narrow, and Fed policy is still subject to incoming data. To sustain momentum, markets will need more than AI enthusiasm; they will require broader sector participation, continued progress on inflation, and labor market data that cools without cracking. Investors should remain alert to the risk that stretched positioning meets seasonal headwinds in the weeks ahead.
OUTLOOK: Neutral – August’s strength highlights resilient momentum, but narrow leadership, high valuations, and September’s seasonal risks argue for caution and selectivity.
Technical Backdrop
As noted, the market finished August in better shape than most investors expected, but the technical picture suggests that the rally is slowing. The S&P 500 ended the week at 6,460, within striking distance of record highs. From a trend perspective, the index remains in a strong uptrend: it sits comfortably above its 20-day moving average (~6,417), the 50-day (~6,316), and the long-term 200-day (~5,959). These moving averages act like “support floors” beneath prices where buyers have historically stepped in. The primary uptrend remains intact if the index holds above those markers. The good news is that money flows turned much more positive over the past week, again showing “dip buyers” stepping in after the pre-Jackson Hole decline.
(Click on image to enlarge)
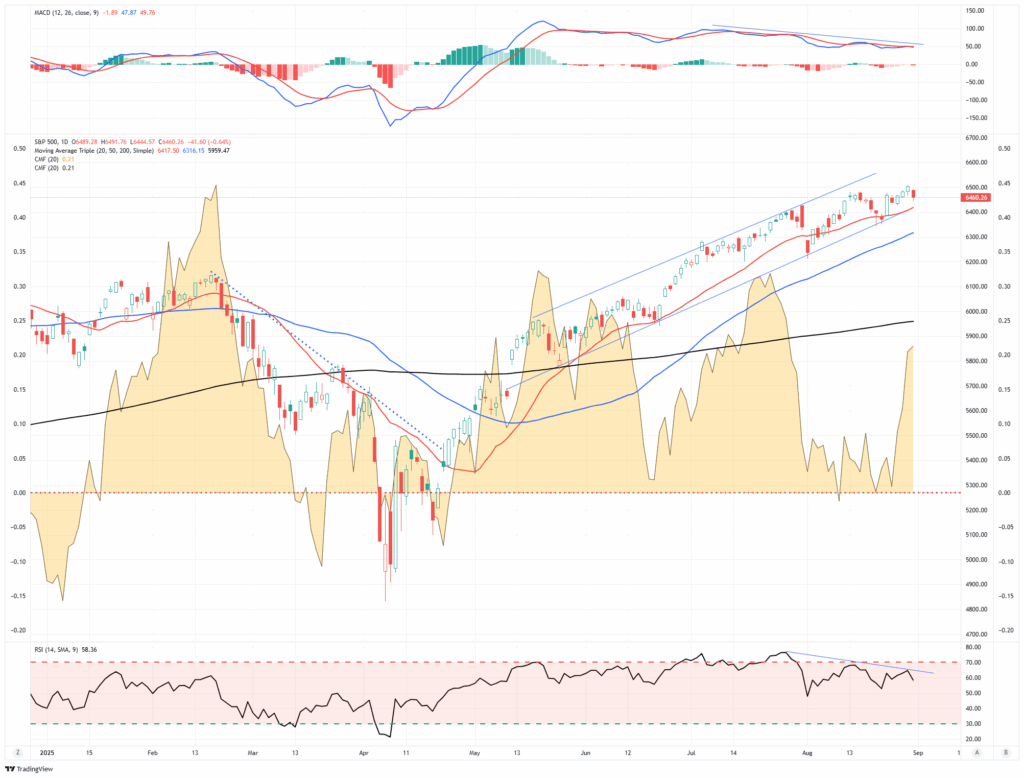
That said, momentum indicators are starting to show fatigue. The Relative Strength Index (RSI), which measures whether stocks are overbought or oversold, has cooled to around 58, a more neutral reading, but most notably remains in a negative divergence from the rising market. Likewise, the stochastic oscillator, another momentum gauge, has dipped into oversold territory, which can sometimes precede a bounce but more often signals that the market’s short-term strength is waning. Lastly, the MACD, which tracks longer-term momentum, is still positive but losing steam and is also negatively diverging from the market. In plain English: the market trend is still upward, but the speed and conviction behind the move are fading.
Breadth, or the number of stocks participating in the rally, remains somewhat narrow. Mega-cap technology continues to do the heavy lifting, while much of the broader index has lagged. Historically, strong and sustainable rallies require broad participation, not just leadership from a handful of names. Without that, the market can be more vulnerable to sudden reversals if sentiment shifts against the leaders.
Putting this together: The market is still technically healthy, but it is running into the seasonal headwinds of September. With momentum indicators flashing signs of fatigue and the rally concentrated in fewer stocks, the risk of a pullback has risen. A modest decline toward the 50-day average near 6,316 would not be unhealthy, as it would help reset conditions and allow for a stronger foundation into year-end. However, such a pullback, while possible, would be painful, and this continues to argue for a risk management protocol.
OUTLOOK: Neutral – The trend remains positive. However, fading momentum and narrow leadership increase the odds of a short-term pullback or sideways consolidation before the market can make another leg higher.
Key Catalysts Next Week
As August closes out on a stronger note than history usually allows, September begins with several market-moving events that could set the tone for the month. While investors remain focused on whether the Federal Reserve will deliver a rate cut at its September meeting, the economic calendar is loaded with critical labor data, surveys, and geopolitical events that could shift sentiment. Seasonal weakness, narrow market breadth, and Fed policy uncertainty all argue for a cautious watch on these developments.
(Click on image to enlarge)
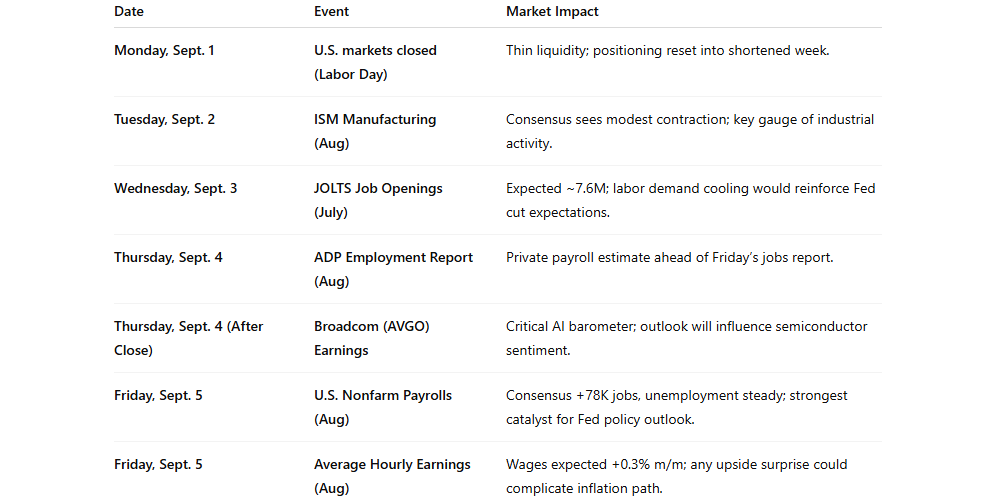
OUTLOOK: With payrolls, wages, and ISM data all converging in a shortened trading week, volatility risks are elevated, and market direction will hinge on whether labor conditions confirm or challenge expectations for a September Fed cut.
Need Help With Your Investing Strategy?
Are you looking for complete financial, insurance, and estate planning? Need a risk-managed portfolio management strategy to grow and protect your savings? Whatever your needs are, we are here to help.
Meme Markets: Investing Vs. Entertainment
Financial markets have transformed; today, trading and speculation have merged into performance art. The “Meme Market” culture now permeates mainstream finance. There was once a time when CEOs reigned as icons leading powerful companies, but today, some executives who once managed companies now lead cults.
For example, Palantir, driven by “Palantarians,” rallied more than 100% this year. Its fans call CEO Alex Karp “Daddy Karp.” Simultaneously, they ignore fundamentals, such as a 520x P/E ratio, a 12.9 PEG ratio, and a 108x price-to-sales. Yes, the company can certainly grow into some of that overvaluation, but most likely not all of it..
Another group remains unyielding to Michael Saylor, who heads up the one flailing company of MicroStrategy, which has been rebranded to just “Strategy,” to signify its new course of converting the company into a leveraged play on bitcoin. He regularly encourages his base with memes to further promote his leverage strategy. His followers congregate on Reddit and X under tags like “Irresponsibly Long $MSTR,” which tells you these investors have also disregarded fundamentals, like a 210x price-to-sales ratio, in favor of a “story.”
These are not investment conversations; they are fandom rituals.
Speculation rides on leverage. As we showed recently, margin debt has exploded over the last two months to the highest level on record, exceeding $1 trillion.
(Click on image to enlarge)

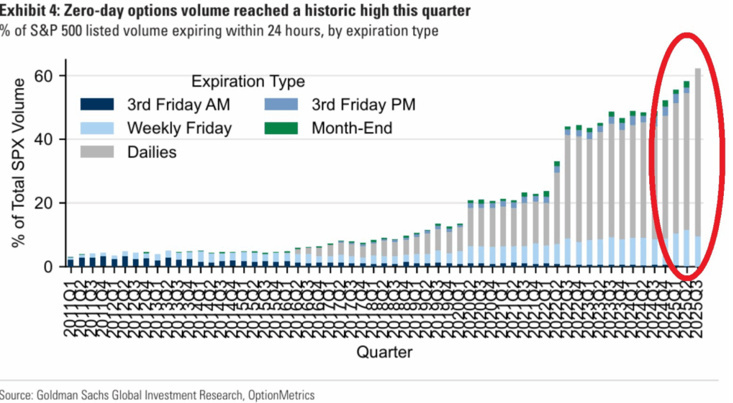
Furthermore, options volumes at meme‑linked names are at records, with short-dated, zero-day-to-expiration (0DTE) contracts now accounting for more than 61 percent of daily S&P 500 option volume. Retail “meme market” investors are responsible for half to 60 percent of that. That sensation feels more like gambling than investing.
(Click on image to enlarge)
The term, coined by Howard Lindzon, “degenerate economy,” captures this shift.
“A ‘degenerate economy,’ or ‘degen economy,’ refers to a speculative and high-risk financial environment where the lines between investing, trading, and gambling are blurred, often accelerated by mobile technology and social media.”
Specifically, in a degenerate economy, financial activities like trading meme stocks, cryptocurrencies, and betting are treated as entertainment rather than a disciplined investment strategy. The thrill of the
“meme market” and the dreams of fast profits are difficult to resist. Howard Lindzon’s index catalogs companies thriving on speculative excess. It includes Robinhood, CME, and Bitcoin-linked stocks. That basket has advanced roughly 23 percent this year versus the S&P 500’s near 10 percent rise.
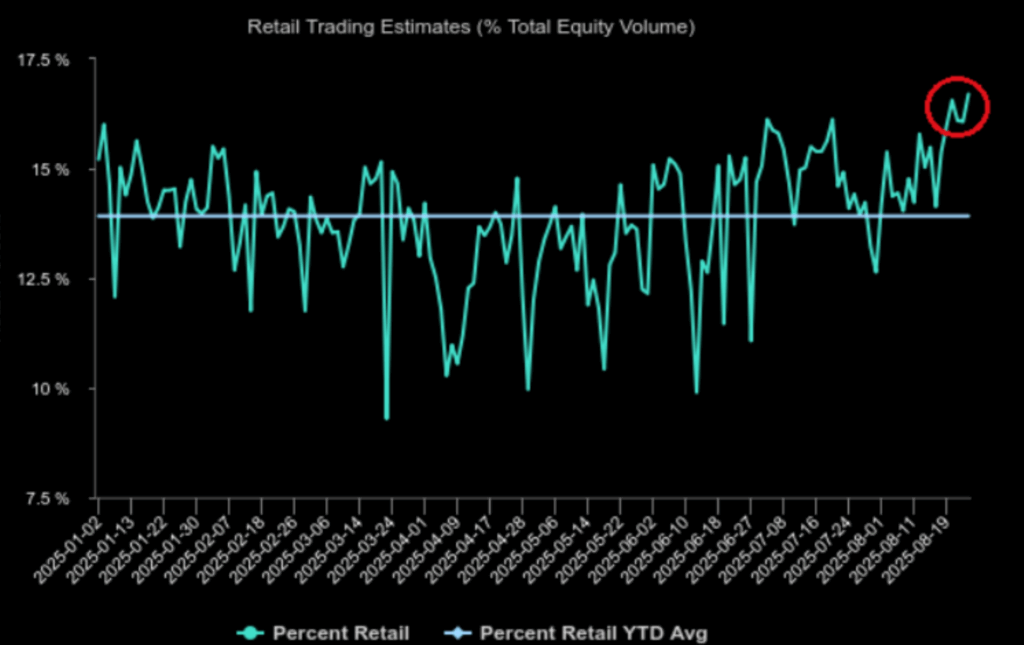
The “meme market” concept has gone viral. As demand for risk has surged, product providers (aka Wall Street) have been happy to oblige. From a return of SPACs to IPOs, a slew of new ETFs, extreme options, and even event betting. For example, the CME teamed with FanDuel to offer event betting, as Coinbase offers 10× leveraged perpetual futures. In other words, the retail markets now mirror casinos. With all that, it is unsurprising that retail trading volume has reached an all-time high as a percentage of total volume.
(Click on image to enlarge)
The question is, what could go wrong?
What Could Go Wrong With A “Meme Market?”
Entertainment-first markets distort the decision-making process. Investors respond to narrative instead of earnings, speculation instead of valuation. Leverage amplifies outcomes, and options magnify risk. In a ‘Meme Market,” bubbles can expand quickly and reversals can be severe. As we noted in last week’s #BullBearReport, valuations are a terrible timing metric as they are a function of investor sentiment in the short term. However, historically, high valuations have always been linked to a form of “Meme Market,” whether it was the 1920s “Golden Age,” the 1960s “Nifty Fifty,” or the 1990s “Dot.com” boom.
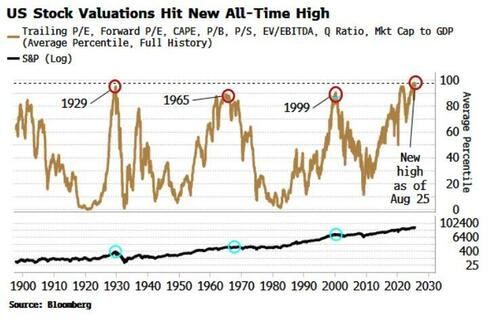
“Valuation is the capstone of proximate causes for a market top, and the one most indicative of the potential magnitude of any subsequent selloff. It’s well known that valuations are high for the US market, but I thought I’d update my aggregate indicator, which combines the main measures of long-term stock-market worth. It previously peaked in April, but has just made a new all-time high this month. Not a welcome sign if you’re a long-term bull.” – Simon White, Bloomberg
Investors have always been drawn to memes throughout the last century. The latest “memes” of cryptocurrency and Artificial Intelligence will eventually meet the same outcomes as reality. While fantastic, those fundamental realities will likely fall short of outrageous expectations. When that happens, the adrenaline-fueled chase will likely result in a “panic-driven” reversal. The psychology of the meme-market and options trading addiction is real, and there have been numerous reports that liken options trading to “crack‑cocaine” for individuals.
“A new type of addict is showing up at Gamblers Anonymous meetings across the country: investors hooked on the market’s riskiest trades. At Gamblers Anonymous in the Murray Hill neighborhood of Manhattan, one man called options “the crack cocaine” of the stock market. Another said he faced hundreds of thousands of dollars in trading losses after borrowing from a loan shark to double down on stocks.And one young man brought his mom and girlfriend to celebrate one year since his last bet.” – WSJ
There are certainly many similarities between cocaine addiction and options trading.
(Click on image to enlarge)

When trading is driven by “sentiment” rather than fundamentals, problems tend to manifest. Such is particularly the case today when “social media sentiment” now leads price action. Algorithms trained on Reddit posts can outperform buy-and-hold in bull markets. How much better? About 70% better in 2023 and 84% in 2021. However, they underperformed during the subsequent market declines, but the influence is material.
“Meme Markets” is structured on entertainment psychology and can defy fundamentals for sustained periods. Retail-driven rallies lift meme-linked equities, and fans hold fast through volatility. The S&P 500 index, as discussed in “Buy Every Dip,” stays buoyed by passive flows that fuel the top-10 stocks in the index regardless of earnings growth.
“While passive flows now dominate the tape, investors are not making decisions. Michael Green noted that “the market has become a giant mindless robot” in describing the enormous, passive capital flows that automatically push stock prices higher. This metaphor refers to the mechanical, non-discretionary purchasing by index funds and other passive investment vehicles that dominate today’s market. The problem is that these flows are “valuation insensitive.” We made such a point in Jesse Livermore’s Approach to Speculation.” To wit:
Passive funds track indexes weighted by market capitalization. As stock prices rise, these funds buy more of the same names, regardless of valuation or fundamentals. This mechanical process has inflated the market value of the largest companies. The top 10 stocks in the S&P 500 now account for more than 38% of the index. That level of passive index concentration has not been seen since the peak of the dot-com bubble. While such concentration may be worrisome, as it elicits memories of the “Dot.com crash,” in the short term, this handful of companies’ performance determines the entire market’s direction.”
(Click on image to enlarge)

Investors mustn’t mistake recent market performance for stability. Meme-market rallies often concentrate within speculative corners. Therefore, the unwinding can intensify swiftly when the narrative shifts, whether triggered by macro shocks, monetary policy surprises, or regulatory whispers. Notably, institutional investors still apply fundamentals. That anchors the broad market to earnings, dividends, and macro data. High forward valuations, rising margin debt levels, and elevated short interest in meme stocks are all textbook signals warning of fragile structure.
An eventual reckoning will arrive. When it does, it will likely be swift and severe. Meme names will tumble, leverage will unwind, and volatility will spike. Like we saw in 2022, the broader market may dip modestly, but speculative components will suffer extensive damage. For long-term capital, the key will be to avoid the blowups while staying invested in fundamentals. And when entertainment fades, only those anchored in valuation, diversification, and discipline will hold through the storm.
Portfolio Tactics – Trading A “Meme Market”
In today’s environment, the lines between investing, trading, and outright gambling have not just blurred; they’ve vanished. Fueled by social media, free trading apps, and zero-day options, financial markets now mirror a digital casino. Retail investors chase emotional highs and viral narratives over revenue streams and cash flow. While it may feel exhilarating to ride these waves, the long-term cost of speculative behavior is steep. The market has constantly rotated between rationality and mania, but this current period of entertainment-first psychology is the most egregious since the dot-com bubble. As passive flows dominate the indices and “meme stocks” pump and dump with little regard for valuation, investors must rely more than ever on discipline to avoid catastrophic errors.
As discussed in “Livermore’s Approach To Speculation:”
“What is crucial about risk management is that in speculative phases, timing is not about guessing the exact turning point. It is about recognizing when the odds have shifted. Today, that means paying close attention to mega-cap stocks that dominate passive index flows and monitoring speculative hot spots like meme stocks, small caps, and high-beta sectors.”
Building a durable portfolio in this environment means having a game plan that prioritizes risk management, not clicks or trending stocks. Here are practical tactics you can use now:
- Cap Speculative Exposure: Limit high-risk trades—meme stocks, crypto plays, zero-day options—to no more than 1% to 2% of your overall portfolio. Treat them like lottery tickets, not investment vehicles.
- Raise Liquidity: In late-stage bull cycles, cash becomes a tactical asset. Build a cash reserve of 10% to 20% to buffer drawdowns and create flexibility during corrections.
- Diversify Intelligently: Move beyond tech-heavy index funds. Allocate across sectors, geographies, and asset classes like Treasuries, commodities, and value stocks.
- Monitor Valuation Risk: Track market cap-to-GDP (Buffett Indicator), forward P/E ratios, and margin debt levels. Today’s extremes signal future volatility.
- Apply Stop-Loss Rules: Use defined exit levels to limit downside on individual positions. Hope is not a strategy.
- Favor Cash-Flow Generators: Companies with real earnings and consistent dividends should be core holdings. Avoid story stocks with no profit visibility.
- Deleverage: If you’re using margin, reduce exposure. Margin debt exceeding $1 trillion is a red flag. Unwind it before the market does it for you.
- Rebalance Quarterly: Trim outperformers and add to underweighted sectors. Rebalancing forces discipline when markets reward excess.
- Turn Off the Noise: Block out the dopamine loop of meme stocks, Reddit threads, and Fintok. Focus on actual investment research and fundamental trends.
Investing in a “meme market” doesn’t mean you can’t follow the crowd; it just means you must control it. Entertainment-driven price action has created the illusion of easy money, but risks are piling up underneath the surface. As history has shown, whether in the Nifty Fifty era, dot-com bubble, or crypto mania, valuation always matters eventually. Investors who stick to discipline, valuation, and risk-adjusted decision-making will be the ones left standing when the hype fades.
Let others chase memes. Your job is to protect capital, compound returns, and stay in the game.
(Click on image to enlarge)

More By This Author:
Energy Price As An Economic Indicator
The Nvidia Earnings Train Keeps On Rolling
As The Fed Turns: The Soap Opera Grows More Intriguing
Treasury Profits Accelerator subscribers are well positioned and ready to profit – from more


