

Image Source: DepositPhotos
We all want to be indispensable. Some of us even want to be remembered for generations. It’s a natural trait for anyone who wants to accomplish great things, such as building a business that will last.
However, at some point we will not continue focusing on growth.
This could be because we’ve “made it” and want to reap the rewards of all the decades of hard work. That accounts for about half the decisions to exit a business and retire. The other half happens involuntarily due to the “Five D’s” & Death, Disability, Divorce, Disagreement, and Distress.
Whatever the reason, whether it’s to reap the rewards of your hard work or protect your family from an involuntary exit, you can best enhance the value of your business by preparing it to run without you.
Making the business less reliant on you creates more options.
Consider the following scenarios:
- Next Level Growth. If you build your management team and enhance your processes so that the business no longer depends on you, you can scale far more than you could on your own. Instead of focusing on the daily work and putting out fires to keep your business running, you can focus on the strategic decisions that can help you scale the business.
- Reduced Workload. Many business owners find their business satisfying and don’t want to quit. I’ve had some owners tell me that retirement would be the worst thing for them: their business is their purpose. However, even passionate business owners may still want some time for family, hobbies, travel, and other things that provide meaning or flavor to life. That will be hard if all the client relationships and processes rely on your decision making. But if you build your bench and improve your processes, you can focus on the higher level decisions while freeing up your time.
- Maximizing Value. Unfortunately, research shows that around 80% of businesses end up closing when the owner retires or attempts to transition to the next generation. This is a shame because you’ve worked decades to build something that has real potential value. But while it may have value to you in the income it generates, it may not have value to a buyer if everything depends on you. For example, if the customers will leave without you being there, what is someone really buying? You want to position the business to make it as easy and attractive for someone to buy it or for the next generation to take it over.
- Protecting Your Family. It’s a fact of life that unexpected hardships happen all the time. If you’re one of the 50% who have to exit your business due to one of the Five D’s mentioned above, what will happen to your family? They have been relying on the income the business is generating. Perhaps you have sacrificed time with them in order to provide for them. By building your team and processes so that you could exit if forced to, even if you don’t have any plans to do so, you are protecting your family.
Key Wealth Principles
- A foundation of good habits is more important than fancy techniques
- Invest in quality businesses at an attractive price
- Build a portfolio of good businesses in different industries
- Maintain appropriate reserves and income sources
- Consider your financial circumstances, liquidity and timing needs, goals, tax considerations, and risk exposure
Building Your Resource Network
Steve Jobs wrote an email to himself a year before he died to remind himself that he did not create many of the things that he relied on to innovate and grow. Things like the food supply, a legal system to protect his rights, medicine, technologies, math, etc. The fact is we all succeed by building on the efforts of others.
It is important to build a network of resources both internally and externally. These resources include M&A advisors, M&A attorneys, SBA lenders, fractional CFOs, CPAs, bookkeepers, business consultants, estate attorneys, mortgage lending, high yield savings, and more.
Last Month’s Winners and Losers
| Winners | Losers |
| Large cap | Risk |
| Profitability | Crypto-currency |
| Momentum | Theme stocks |
| Semiconductors | Oil and gas |
| Consumer staples | Small cap |
| Real estate | Regional banks |
| Utilities | Mexican stocks |
Last month saw continued strength from large, profitable companies. With the prospect of lower interest rates, dividend-oriented sectors such as consumer staples, real estate, and utilities also did well. Riskier areas like crypto-currency, theme stocks, and small cap stocks did poorly, as did regional banks, which will earn less interest on their short-term assets. Other areas, such as oil and gas, Mexican stocks, and Chinese Internet stocks did poorly because of dynamics specific to their own sector or sphere.
Stocks
| S&P 500 |
Dow Jones U.S. Select Dividend |
Russell 2000 |
Bloomberg U.S. Long Treasury |
|
| One Month Return | 2.4% | 3.1% | -1.5% | 2.0% |
| Year-to-Date Return | 19.5% | 16.5% | 10.4% | 0.4% |
| 10yr Return | 13.0% | 9.9% | 8.0% | 0.7% |
| 20yr Return | 10.7% | 8.7% | 8.7% | 3.8% |
| 30yr Return | 10.7% | 11.1% | 8.9% | 5.6% |
Source: FactSet as of 9/1/2024. We use the S&P 500 index as an illustration of the performance of large cap stocks, the Dow Jones U.S. Select Dividend index as an illustration of the performance of high dividend stocks, the Russell 2000 index as an illustration of the performance of small cap stocks, and the Bloomberg US Long Treasury index to illustrate the performance of treasury bonds with maturities greater than 10 years out.
While the market started off rough in the beginning of August with a sharp decline after Japan raised interest rates, it quickly recovered, small caps excluded. This was driven primarily due to the prospect of falling interest rates as well as overall solid second quarter earnings reports.
At this point, large caps remain somewhat expensive overall and particularly expensive in the mega cap growth and Big Tech space. There is solid earnings growth which should continue driving returns as long as it continues, but the mega cap part of the market is vulnerable to any disappointments given how high the valuation is.
Dividend-oriented and small cap stocks have a more reasonable valuation and still exhibit solid earnings growth. However, selection is more important in these areas as there is a bigger difference between high quality and low quality companies.
| Large Cap | Dividend | Small Cap | |
| Stocks | Stocks | Stocks | |
| Dividend Yield | 1.3% | 3.1% | 1.5% |
| Earnings Yield * | 4.9% | 5.7% | 6.0% |
| Earnings Growth | 10.9% | 8.4% | 16.1% |
| Return on Equity | 17.6% | 12.0% | 10.3% |
| % Losing Money | 6.2% | 5.9% | 38.8% |
Source: FactSet as of 9/1/2024. Dividend Yield is an estimate based on the weighted average of all companies in the category (by market cap). Earnings Yield, Earnings Growth, and Return on Equity are estimates based on the median profitable company. The % Losing Money statistic represents the percent of stocks with negative earnings in the preceding 12-month period. Large Cap stocks are defined here as the stocks in the S&P 500, according to FactSet. Dividend Stocks are defined here as the stocks within the S&P 500 that pay an above-median dividend yield, according to FactSet. Small Cap stocks are defined here as U.S. stocks ranked 1,001 to 3,000 in market capitalization, according to FactSet.
Artwork

“The Old Reliable McFadden’s Flats - Everything New” by U.S. Lithograph Co. (1902). Source: Library of Congress.
Income Investing
| Interest Rates | Dividend Yields | ||
| 1yr Treasuries | 4.4% | Common Stocks | 1.3% |
| 10yr Treasuries | 3.8% | —Top 25% | 3.9% |
| 10yr TIPS | 1.7% | —Next 25% | 2.4% |
| Muni Bonds (5yr AAA) | 2.5% | Preferred Stocks | 6.0% |
| Corp Bonds (5yr A) | 4.3% | Real Estate (REITs) | 3.3% |
| 30yr Fixed Mortgages | 7.0% | Utilities | 3.3% |
Source: Interest rates from Raymond James’ Weekly Interest Rate Monitor as of 8/26/2024 and The Wall Street Journal as of 9/1/2024. Source for the Dividend Yields is from FactSet as of 9/1/2024. Common Stocks uses the estimated weighted average dividend yield for the S&P 500. The top 25% yield is the median yield of the top quartile of dividend-paying stocks out of the largest 1,000 stocks. The next 25% yield is the median of the second quartile. Preferred Stocks is the median dividend yield of the 100 largest traded preferred stocks (by dollar volume, per FactSet). REIT and Utilities dividend yields are the median of those sector stocks included in the 1,000 largest common stocks.
Short-term and long-term interest rates have fallen given expectations of rate cuts going forward. Recent inflation reports have fallen in the 1-2% core inflation rate, which is well within the Federal Reserve’s target zone and supports rate cuts. There is a longer term risk to inflation reigniting because the government continues to run massive deficits and there will be pressure to fund these deficits with printed money if investor demand slackens, but the near term outlook for inflation is positive.
With the recent rise in dividend-oriented stocks, yields have fallen, but it is still possible to find good quality, growing companies yielding 3-4%.
The Long View
S&P 500, Jan. 1928 to Dec. 2023
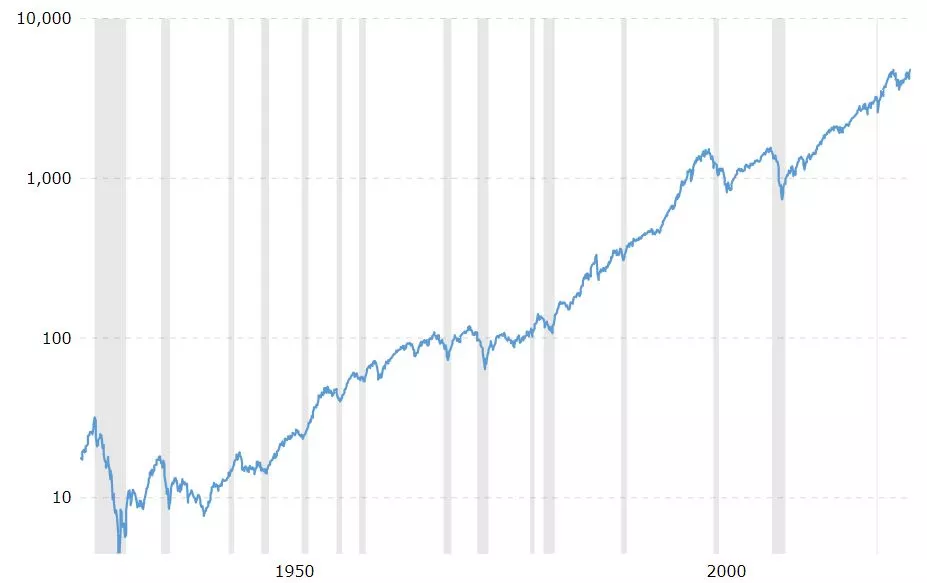
Source: MacroTrends.net
For the last 20, 30, and 100 years, stocks have averaged around an 8-10% return, driven by dividend yield, reinvestment of earnings, and earnings growth. Long-term bonds have yielded about 5% on average over the last century while inflation has been about 3%.
Throughout this period, there have been major upheavals, such as the Great Depression, World War II, The Korean War, The Vietnam War, dropping the gold standard, 1970s high inflation, 1987’s Black Monday Crash, the Dot.com bust, the 9/11 terror attacks, the Global Financial Crisis, and the Covid Crash, among others.
These events led to severe market downturns about once every decade, with a median price decline of 33% and a median time to recover back to the previous high of 3.5 years. If we were to include dividends, the recovery to previous highs is actually a little faster. *
Meanwhile, a 3% inflation rate results in a 59% decline in the value of a dollar over 30 years. Meaning that people who retire at 60 years old on a fixed income face a high risk of a lower quality of life as they get further into retirement. *
The Price of Market Returns: Significant Volatility
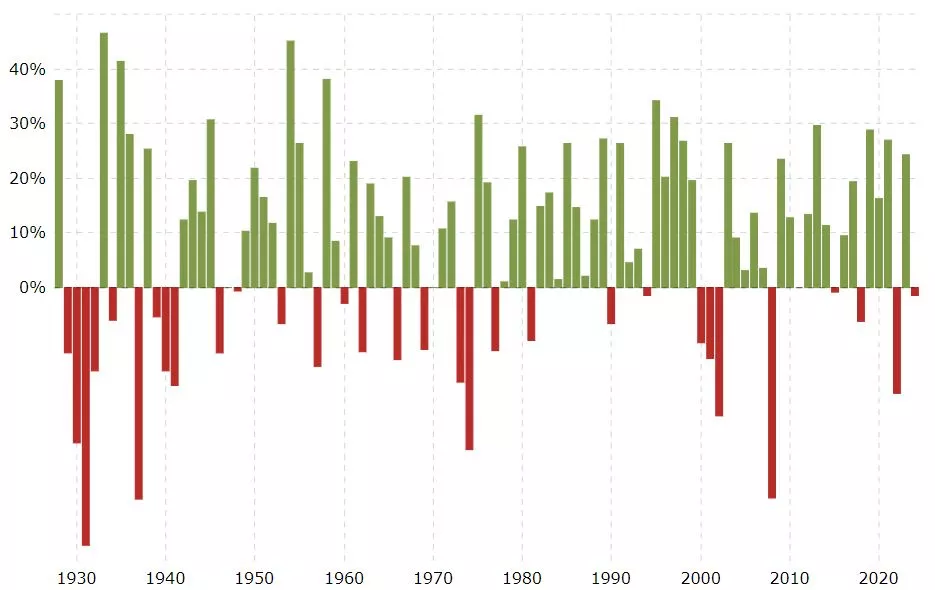
S&P 500 Yearly Returns, 1928 to 2023. Source: MacroTrends.net
* Source: Morningstar Direct via cfainstitute.org, FactSet. Past performance is not necessarily indicative of future performance. Depreciation of the dollar: $1 / (1 + 3%)^30 = $0.41 real value 30 years later.
Market Outlook
Now I’ll put on my “Nostradamus Hat” and make some predictions, for whatever they’re worth:
- Inflation will average 2-5% over the next 10 years.
- Interest rates will fall in the 3-6% range for 10yr Treasuries over the next several years, in line with inflation and historical experience.
- The economy will grow 2-3% in real terms over the next several years.
- Stocks will average an 8-10% return over the next 10+ years. After subtracting inflation, this will translate into about a 5% real return. There is likely to be at least one big decline every decade or so.
From the standpoint of where you and your family will be in 30 years, none of this matters. What matters is finding good quality investments that are likely to grow over the decades. For this reason, I largely ignore my own general market forecast and invest whenever I find a business that I am confident in and that trades at an attractive valuation.
More By This Author:
Sound Decisions Vs. Monday Morning Quarterbacking
Finding Good Quality Investments
Opportunities In Stocks And Bonds


Comments
Log in or sign up to join the conversation.