Inflation Adjusted Wages Since The Pandemic
Inflation exceeds average hourly earnings in the aggregate (private sector) and for Leisure and Hospitality Services (production and nonsupervisory). But they are still ahead of 2020M02 levels.
Figure 1: Average hourly earnings in private nonfarm payroll (blue, left log scale), and in leisure and hospitality services (brown, right log scale), both in 2020$/hour. 2022M04 real wage uses Cleveland Fed CPI nowcast (5/6). Source: BLS via FRED, Cleveland Fed, and author’s calculations.
Note that Cleveland Fed April CPI nowcast is 0.28% m/m, compared to Bloomberg consensus of 0.2%. If Wednesday’s release exceeds 0.28%, then real average hourly earnings might decline again.
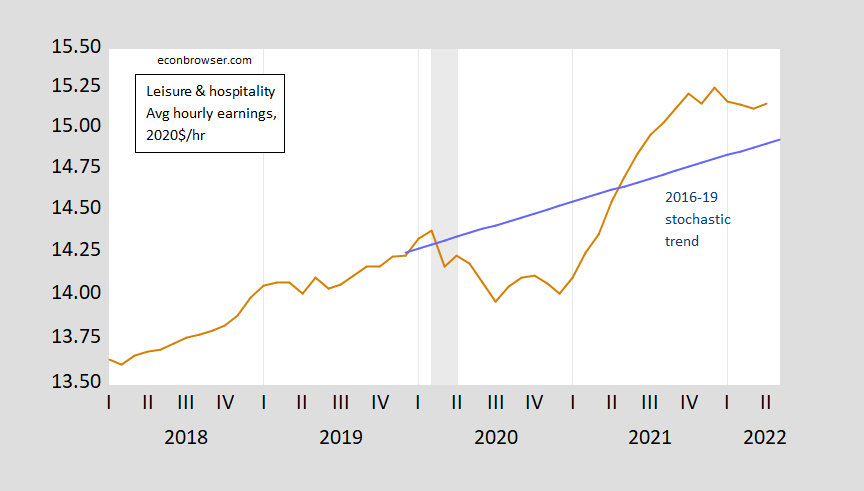
While both real wage series are higher than pre-2020M03 (not holding composition constant), it’s interesting to note that leisure and hospitality services earnings are above the 2016-19 trend.
Figure 2: Average hourly earnings in leisure and hospitality services (brown) and 2016-19 stochastic trend (light blue), both in 2020$/hour. 2022M04 real wage uses Cleveland Fed CPI nowcast (5/6). Source: BLS via FRED, Cleveland Fed, and author’s calculations.
A caveat: My comparison is pre- vs. during the pandemic, and using the CPI as a representative cost-of-living indicator. As noted by Rampell/WaPo, over the past year (2020Q4-2021Q4), the cost of living for low-income households has risen more than for high-income households. That’s consistent with the fact that the CPI is a plutocratic index, representing consumption weights for households at about the 75th percentile. Using a CPI calibrated to say the 20th percentile might change results noticeably.
Disclosure: None.


