

Image Source: Pexels
CNN published an article today, entitled “What’s really happening in America’s economy”. Most points are conventional, but one graph was interesting – credit card debt:
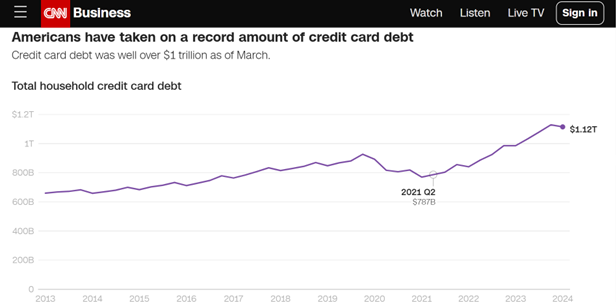
Source: CNN.
Besides the usual complaints that this number was not normalized by disposable personal income, or GDP, this struck me as a funny indicator to glom onto. Here’s normalized credit card debt along with delinquency rate.
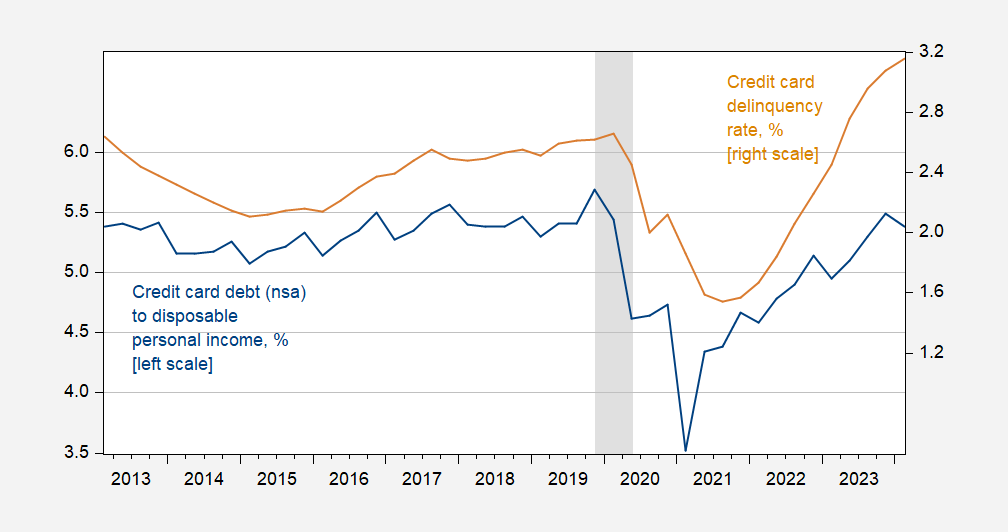
Figure 1: Credit card debt (n.s.a.) to disposable personal income, % (blue, left scale), and credit card delinquency rate for all commercial banks, % (tan, right scale). NBER defined peak-to-trough recession dates shaded gray. Source: NY Fed; Federal Reserve Board and BEA via FRED, NBER, and author’s calculations.
So credit card debt normalized is going down in Q2, but delinquencies are rising. This suggests that something is going on, for some segments of the population, even while household debt-to-GDP and household debt service to disposable income ratios are falling.
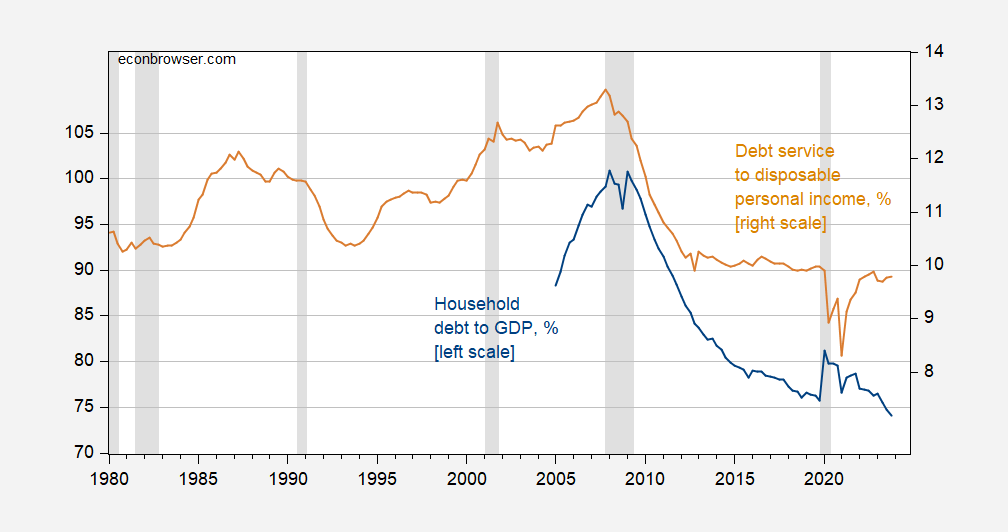
Figure 2: Household debt to GDP, % (blue, left scale), and debt service to disposable income rate, % (tan, right scale). NBER defined peak-to-trough recession dates shaded gray. Source: IMF via FRED, Federal Reserve Board via FRED, NBER.
Debt service might be constant even as interest rates rise due to the pervasiveness of fixed rate mortgages. So, credit woes are likely more pressing for some income segments than others.
More By This Author:
Fed Board: “Why Is The U.S. GDP Recovering Faster Than Other Advanced Economies?”One Year Ahead Inflation Expectations for 2025
Eric Hovde Predicts


Comments
Log in or sign up to join the conversation.