

Image Source: Pexels
- On Friday, the USD/JPY currency pair traded in the green for the fifth consecutive day, resting around the critical 145.00 zone.
- The US dollar continued to strengthen after higher-than-expected US PPI data from July.
- Investors continued to bet on a less aggressive stance by the Bank of Japan, causing the yen to lose interest.
On the last day of the trading week, the USD/JPY currency pair rose near the 145.00 zone, presenting more than 2% of weekly gains. This movement was driven by vital Producer Price Index (PPI) numbers from the US and optimistic personal consumer confidence data released by the University of Michigan (UoM).
US treasury bond yields increased and showed more than 1% of daily gains from this. On the Japanese side, the yen continued to trade weakly as investors continued to place bets on a dovish stance by the Bank of Japan (BoJ).
Hawkish Bets on The Fed After Inflation Data Favored the US Dollar
On Friday, PPI data saw the headline figure jumping to 2.4% year-over-year in July, slightly higher than expected. These figures arrived in the same week that US data revealed that the headline and core Consumer Price Index (CPI) decelerated in July. Thus, overall, the US inflation outlook appears mixed.
That being said, US bond yields were seeing gains across the curve, driven by hawkish bets on the Federal Reserve. The 10-year bond yield rose to 4.18%, while the 2-year yield stood at 4.90%, and the 5-year yielded 4.31%. In line with that, the CME FedWatch tool indicated that the odds of a 25 basis point (bps) hike in the November meeting rose to nearly 30%, but the odds still remained low for the upcoming September decision.
On the yen’s side, no relevant data was released. The focus shifted instead to next week's Gross Domestic Product (GDP) data for Q2 from Japan.
USD/JPY Levels to Watch
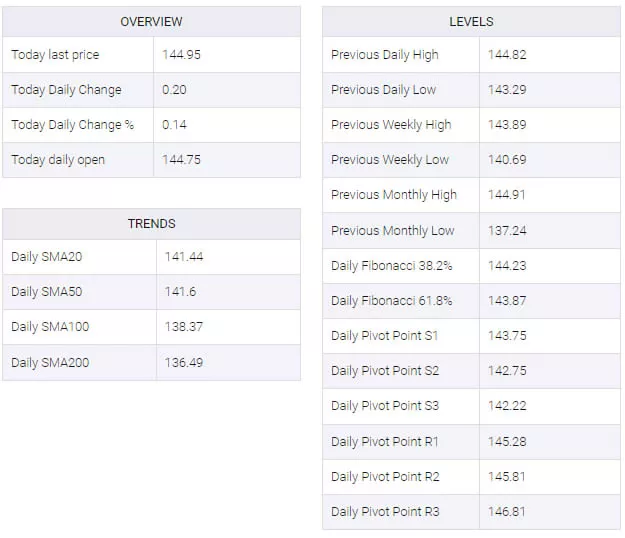
Considering the daily chart, the USD/JPY currency pair appeared to maintain a bullish outlook for the short-term. The Relative Strength Index (RSI), positioned above its midline in positive territory with a northward slope, supported this view along with the positive indication from the Moving Average Convergence Divergence (MACD), which displayed green bars, pointing towards a strengthening bullish trend.
On the other hand, the pair was seen above the 20-day, 100-day, and 200-day Simple Moving Averages (SMAs), indicating that the bulls were in command of the broader picture.
- Support levels were seen at 143.70, 143.00, and 142.00.
- Resistance levels were seen at 145.00, 145.50, and 146.00.
USD/JPY Daily Chart
-638273807969935913.png)
USD/JPY Technical Levels
More By This Author:
USD/JPY Approaches 145.00 As US PPI Rose Strongly
Silver Price Analysis: Hangs Near One-month Low, Seems Vulnerable To Slide Further
USD/CHF Price Analysis: Remains Inside The Woods Below 0.8800


Comments
Log in or sign up to join the conversation.