
Silver lacks any firm intraday directional bias on Friday and seesaws between tepid gains/minor losses through the early part of the European session. The white metal currently trades around the $22.70 region, nearly unchanged for the day and just above over a one-month low touched on Wednesday.
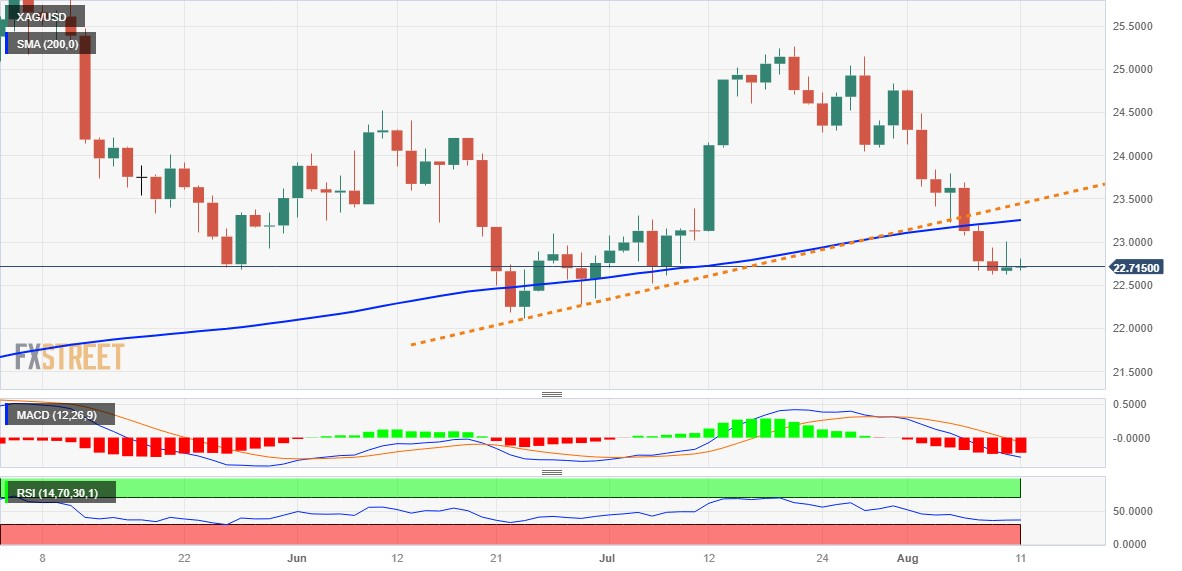
The technical setup, meanwhile, suggests that the path of least resistance for the XAG/USD is to the downside. This week's sustained break below the $23.30-$23.20 confluence – comprising the very important 200-day Simple Moving Average (SMA) and a short-term ascending trend-line – was seen as a fresh trigger for bearish traders. Adding to this, oscillators on the daily chart are holding deep in the negative territory and are still far from being in the oversold zone. This, in turn, supports prospects for an extension of the recent downward trajectory witnessed over the past three weeks or so.
Hence, any subsequent move up towards the $23.00 round figure might still be seen as a selling opportunity and remain capped near the $23.20-$23.30 confluence support breakpoint, now turned resistance. The latter should act as a pivotal point, which if cleared decisively might trigger a short-covering move. The XAG/USD might then accelerate the recovery momentum towards the $23.60-$23.65 horizontal barrier before aiming to reclaim the $24.00 mark.
On the flip side, the $22.65-$22.60 area, or the weekly low, could act as immediate support. The XAG/USD, however, seems vulnerable to retesting the multi-month low, around the $22.15-$22.10 area touched in June. Some follow-through selling below the $22.00 mark will expose the $21.55-$21.50 intermediate support and the $21.00 mark. The downward trajectory could get extended towards the $21.00 round figure en route to the YTD low, or levels just below the $20.00 psychological mark touched in March.
Silver daily chart
(Click on image to enlarge)
Technical levels to watch
XAG/USD
| OVERVIEW | |
|---|---|
| Today last price | 22.74 |
| Today Daily Change | 0.03 |
| Today Daily Change % | 0.13 |
| Today daily open | 22.71 |
| TRENDS | |
|---|---|
| Daily SMA20 | 24.15 |
| Daily SMA50 | 23.68 |
| Daily SMA100 | 24.06 |
| Daily SMA200 | 23.24 |
| LEVELS | |
|---|---|
| Previous Daily High | 23 |
| Previous Daily Low | 22.63 |
| Previous Weekly High | 24.84 |
| Previous Weekly Low | 23.23 |
| Previous Monthly High | 25.27 |
| Previous Monthly Low | 22.52 |
| Daily Fibonacci 38.2% | 22.86 |
| Daily Fibonacci 61.8% | 22.77 |
| Daily Pivot Point S1 | 22.56 |
| Daily Pivot Point S2 | 22.4 |
| Daily Pivot Point S3 | 22.18 |
| Daily Pivot Point R1 | 22.93 |
| Daily Pivot Point R2 | 23.15 |
| Daily Pivot Point R3 | 23.3 |
More By This Author:
USD/CHF Price Analysis: Remains Inside The Woods Below 0.8800USD/CAD Remains On The Defensive Below Mid-1.3400s, Bullish Potential Seems Intact
Fed’s Daly: US July CPI Is A “Good Data point”


Comments
Log in or sign up to join the conversation.