
Photo by Claudio Schwarz on Unsplash
- USD/CHF oscillates in a wide range and fails to find a decisive move despite the US inflation data release.
- US monthly inflation grew at a 0.2% pace, in alignment with the Fed’s desired rate of 2%.
- The market mood turns cautious as US President authorized a ban on some investments in China in some sensitive technologies.
The USD/CHF pair stays in a sideways profile below the round-level resistance of 0.8800 in the European session. The Swiss Franc asset struggles to find direction despite lower-than-expected growth in the United States Consumer Price Index (CPI) data for July.
Monthly inflation grew at a 0.2% pace, in alignment with Federal Reserve’s (Fed) desired rate of 2%. The US Dollar Index (DXY) is aiming to resume its upside journey after a sideways performance ahead of US Producer Price Index (PPI) data.
The market mood turns cautious as US President Joe Biden authorized to ban some investments in China in some sensitive technologies in three sectors: semiconductors and microelectronics, quantum information technologies, and certain artificial intelligence systems.
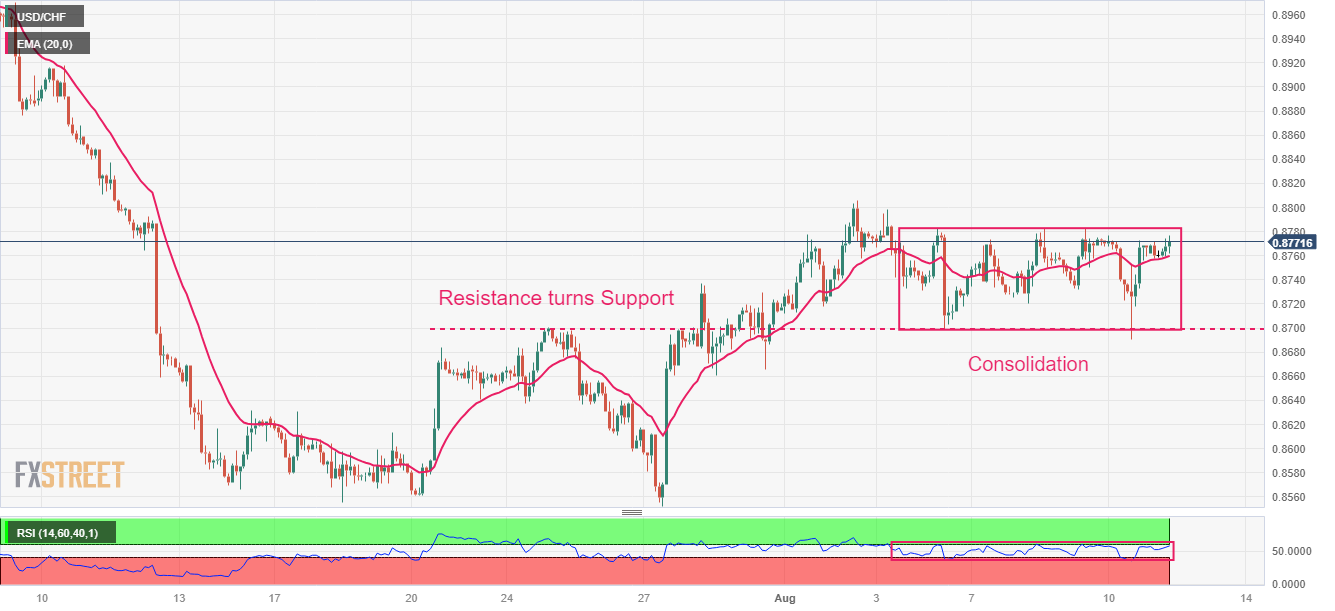
USD/CHF traded directionless from the past week despite slower growth in the US inflation. The major turned sideways after a firmer rally after climbing above the horizontal resistance plotted from July 24 high at 0.8700, which turned into support now. The asset oscillates in a range of 0.8700-0.8783, which indicates volatility contraction.
The pair makes efforts to maintain an auction above the 20-period Exponential Moving Average (EMA) at 0.8760.
Momentum oscillator Relative Strength Index (RSI) (14) trades inside the 40.00-60.00, indicating a volatility squeeze.
Going forward, a decisive break above August 2 high at 0.8806 will drive the asset towards April 26 low at 0.8852, followed by June 16 low around 0.8900.
In an alternate scenario, a downside move below August 10 low at 0.8690 would drag the asset toward July 17 high at 0.8630 and July 27 low at 0.8552.
USD/CHF two-hour chart
(Click on image to enlarge)
USD/CHF
| OVERVIEW | |
|---|---|
| Today last price | 0.8766 |
| Today Daily Change | -0.0001 |
| Today Daily Change % | -0.01 |
| Today daily open | 0.8767 |
| TRENDS | |
|---|---|
| Daily SMA20 | 0.8689 |
| Daily SMA50 | 0.8849 |
| Daily SMA100 | 0.8926 |
| Daily SMA200 | 0.9129 |
| LEVELS | |
|---|---|
| Previous Daily High | 0.8777 |
| Previous Daily Low | 0.869 |
| Previous Weekly High | 0.8806 |
| Previous Weekly Low | 0.8665 |
| Previous Monthly High | 0.9005 |
| Previous Monthly Low | 0.8552 |
| Daily Fibonacci 38.2% | 0.8723 |
| Daily Fibonacci 61.8% | 0.8744 |
| Daily Pivot Point S1 | 0.8713 |
| Daily Pivot Point S2 | 0.8658 |
| Daily Pivot Point S3 | 0.8626 |
| Daily Pivot Point R1 | 0.8799 |
| Daily Pivot Point R2 | 0.8832 |
| Daily Pivot Point R3 | 0.8886 |
More By This Author:
USD/CAD Remains On The Defensive Below Mid-1.3400s, Bullish Potential Seems Intact
Fed’s Daly: US July CPI Is A “Good Data point”
USD Index Price Analysis: The 102.80 Region Caps The Upside So Far


Comments
Log in or sign up to join the conversation.