U.S. Extends Massive Leads In Natural Gas Production And LNG Exports
In June, the Energy Institute released the 2024 Statistical Review of World Energy.

Image Source: depositphotos
The Review provides a comprehensive picture of supply and demand for major energy sources on a country-level basis. Each year, I do a series of articles covering the Review’s findings.
Today I will discuss trends in natural gas production and consumption.
Overview
Global natural gas (UNG) demand increased by only 1 billion cubic meters (bcm) in 2023, a marginal rise of 0.02%, barely above the 2019 pre-COVID level. While natural gas maintained a 29% share of global fossil fuel consumption, its share of total primary energy consumption has fallen by 0.5% since 2019.
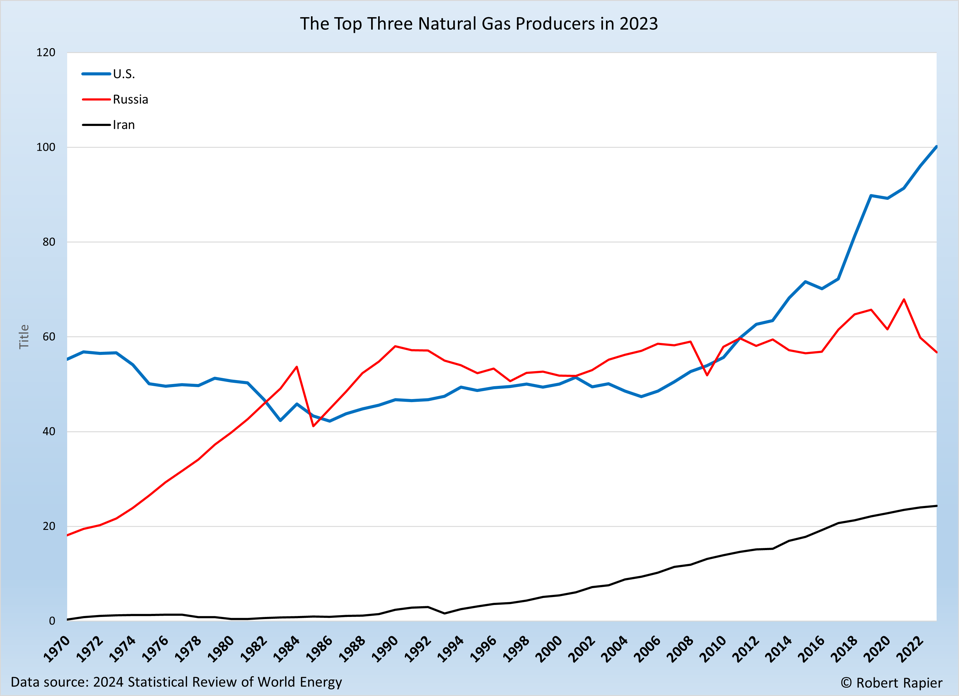
Global gas production remained steady compared to 2022, with the U.S. continuing to be the largest producer, supplying about a quarter of the world’s gas. However, Europe experienced a production decline of approximately 7%, while the Russia saw an absolute decline of 5%. The top four regions, which account for 80% of global gas production, are also responsible for 85% of its consumption.

The Top 3 Natural Gas Producers in 2023. ROBERT RAPIER
Natural gas prices in Europe and Asia dropped by 30% from their 2022 record highs, averaging around $13/mmBtu. U.S. Henry Hub prices fell even more dramatically, decreasing by 60% to an average of $2.5/mmBtu, returning to their pre-COVID 2019 levels.
Russia’s share of European Union gas imports continued to decline, dropping from 45% in 2021 to 24% in 2022, and further to 15% in 2023, placing it behind Norway and the U.S.
LNG supply grew by nearly 2% (10 bcm) to reach 549 bcm in 2023. Over the past eight years, U.S. LNG exports surged from 0.2 bcm in 2013 to 114 bcm in 2023, making the U.S. the world’s leading LNG supplier, surpassing Qatar and Australia. The U.S. increased its supply by nearly 10%, while Qatar’s supply dropped by 2%. Russia saw decreases in both LNG and pipeline exports, with LNG dropping by nearly 2% (0.8 bcm) and pipeline supplies falling by around 24% (30 bcm).
The Asia Pacific region, particularly China, India, and other non-OECD countries, drove global growth in LNG demand, increasing by 11 bcm, 2.6 bcm, and 7.6 bcm, respectively. Conversely, LNG imports to Europe and OECD Asia Pacific countries declined by 3 bcm and 11 bcm, respectively.
China reclaimed its position as the world’s largest LNG importer, followed by Japan and South Korea, together accounting for about 45% of global LNG trade. Overall, natural gas pipeline net trade decreased by approximately 8% (35 bcm) in 2023, with European pipeline imports dropping by 26% (40 bcm), largely due to a 91% reduction in supplies from Russia.
The Top Producers
As was the case with crude oil, the United States was the world’s top natural gas producer in 2023. The U.S. produced 25.5% of the world’s gas in 2023, extending its lead over Russia and Iran.

Top 10 Gas Producers in 2023. ROBERT RAPIER
“Change” reflects the percentage change from 2023.
The countries in the Top 10 are the same as a year ago, except a few countries changed positions. China made a big move up from 2022 and may soon threaten Iran’s spot in the third position.
The Top Consumers
The U.S. also maintains a dominant lead over other countries in natural gas consumption, but the increase from 2022 was only 0.8%.

Top 10 Gas Consumers in 2023. ROBERT RAPIER
There has been more of a shakeup among the top 10 consumers. Mexico made a significant jump from last year, as did China, and the UK fell off the list, replaced by the UAE.
Conclusions
In conclusion, the 2024 Statistical Review of World Energy showed a marginal increase in global natural gas demand, reflecting the ongoing recovery from the pandemic. The United States continues to dominate both production and consumption, with significant increases in LNG exports solidifying its position as the world’s leading LNG supplier.
Europe’s declining natural gas demand and production, coupled with a dramatic decrease in Russian gas imports, mark a significant shift in the region’s energy landscape. Meanwhile, the Asia Pacific region, driven by China and India, has become a major force in global LNG demand.
These trends underline the dynamic and evolving nature of the global natural gas market, shaped by geopolitical shifts, technological advancements, and changing consumption patterns. As we move forward, understanding these changes will be crucial for stakeholders in the energy sector.
More By This Author:
Did President Trump Reduce Gas Prices?
U.S. Oil Production Develops Massive Lead Over Russia And Saudi Arabia
U.S. Energy Independence Soars To New High
Follow Robert Rapier on Twitter, more


Good article. Thank you