The Recent Pound Plunge In Context: 50 Years Of The Real Rate
The drop in the pound over the last week was dramatic (FXB).

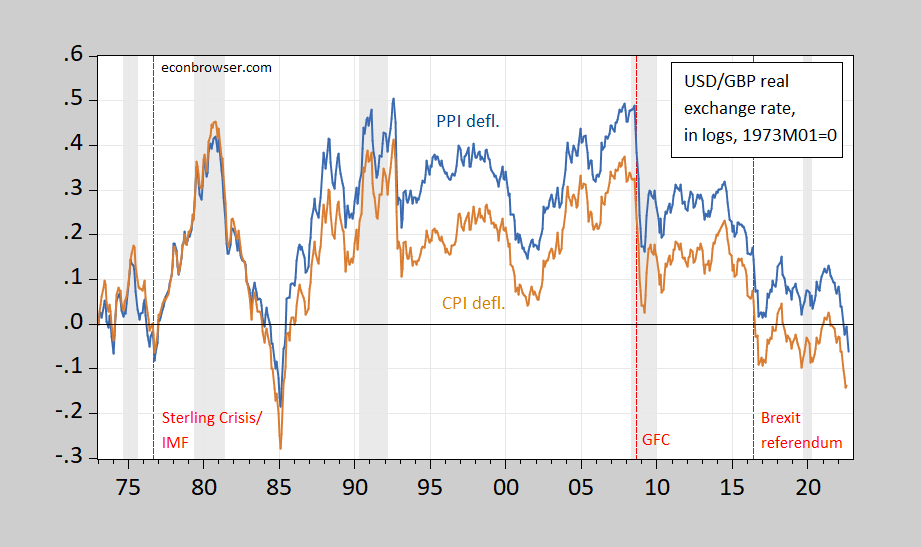
But even with the recovery in the currency’s value to pre-mini-budget levels, the pound has been on a downward trend for the past six years, in inflation adjusted terms.
Figure 1: PPI deflated real GBP/USD exchange rate (blue), and CPI deflated (tan), both in logs, 1973M01=0. Downward movements denote depreciation of the Pound. Sept values for PPI assumes continued decline at August rate. Bloomberg consensus for UK CPI; Cleveland Fed nowcast for US CPI. ECRI defined recession peak-to-trough recession dates shaded gray. Source: Fed via FRED, BLS, ONS, and author’s calculations.
One way to look at the events of September is that its the third persistent negative terms of trade shock the pound has experienced in the past 15 years, the first being the Global Financial Crisis, and the second being Brexit. The downward moves in the PPI deflated real rate are more remarkable (in my opinion) since they reflect a deterioration in the terms of trade of ostensibly tradable goods.
How do formal statistical tests relate to this assertion. The PPI deflated rate rejects the unit root null at the 13% msl using the ADF test (6% for the unit root test). That means that PPP for traded goods/PPI is not strongly apparent. A Bai-Perron recursive structural break test identifies breaks at 1987, 2000, and 2015. The 2015 break is close to the Brexit referendum.
More By This Author:
GDPNow Q3 at 2.4% SAAR
Business Cycle Indicators At September’s End
UK Measured Economic Policy Uncertainty In Context


