
According to official data published by the National Bureau of Statistics, China’s growth q/q seasonally adjusted slowed considerably in Q3, to 0.2% (not annualized), below the Bloomberg consensus of 0.5%. The four-quarter growth rate was 4.9%, vs consensus of 5.2%.
Figure 1 depicts real GDP over the period NBS reports it:
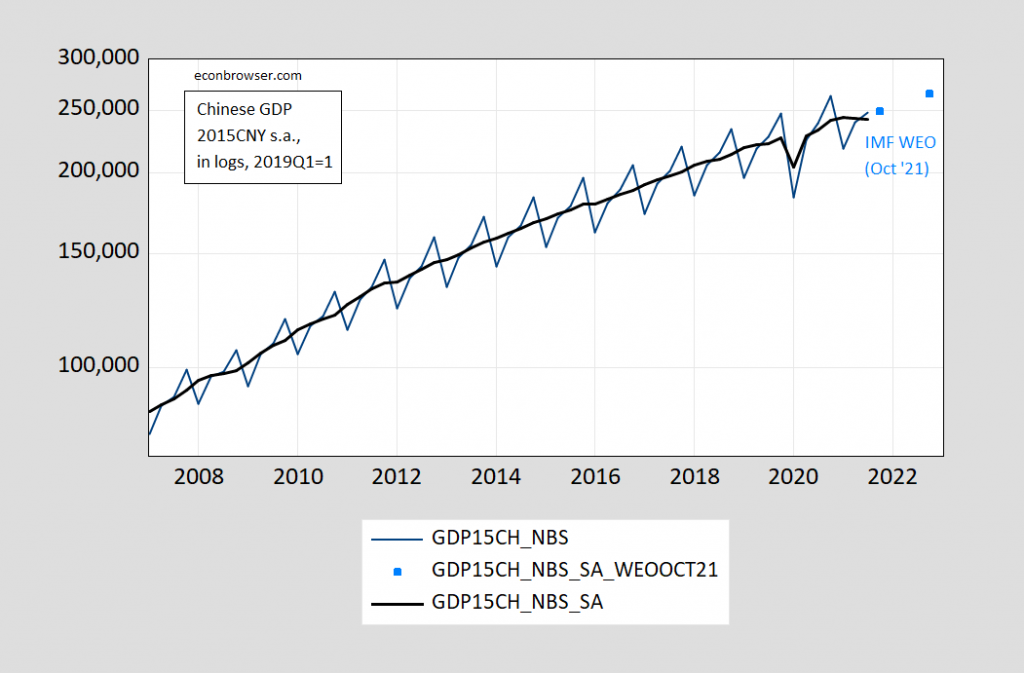
Figure 1: Chinese real GDP, in 100 mn 2015 CNY (blue), seasonally adjusted using Census X-12/X-11 seasonal filter (black), and IMF WEO forecasts (sky blue squares), on log scale. GDP in constant 2015CNY calculated by author by using IMF WEO GDP price deflator to convert implicit deflators to a common base year. Source: China National Bureau of Statistics, IMF October 2021 WEO, and author’s calculations.
Using the seasonally adjusted, and applying the IMF’s forecasts to these seasonally adjusted numbers, it’s clear how much the Q3 figure was a miss given expectations.
In my mind, it’s a bit mysterious how the q/q growth numbers were obtained. On the NBS website, seasonally unadjusted nominal GDP numbers are reported, seasonally unadjusted real numbers in different constant yuan, and seasonally adjusted q/q real growth rates (from 2011 onward). That means it is not straightforward to replicate the implied Chinese seasonally adjusted GDP level since they use an in-house seasonal adjustment methodology (NBS-SA, see here). I apply several seasonal adjustment procedures, including a geometric ratio to a moving average, Census X-12/seasonal filter X-11, and ARIMA Census X-12/seasonal filter X-11, and compare against the implied GDP series obtained by cumulating NBS reported q/q changes.
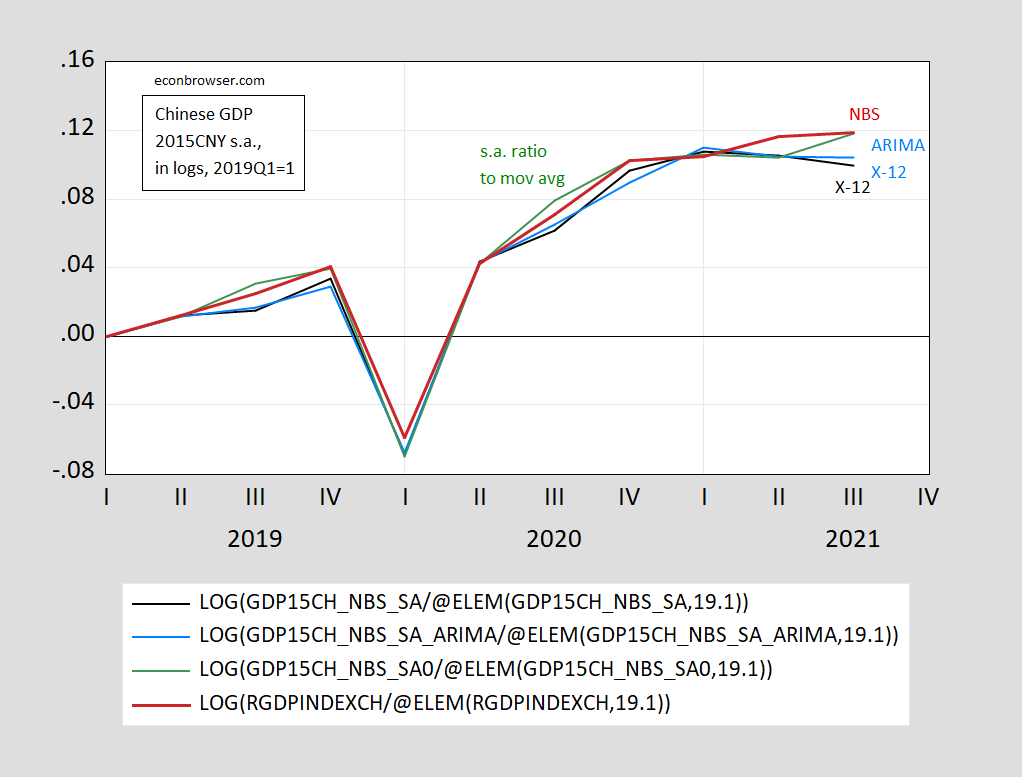
Figure 2: Chinese real GDP estimated using Census X-12/seasonal X-11 (black), ARIMA Census X-12/seasonal X-11 (sky blue), ratio to moving average (green), and implied by NBS reported q/q growth rates (red), all in logs, normalized to 2019Q1. Source: NBS, and author’s calculations.
Notice that the official series indicates continued growth albeit slow, while standard seasonal adjustment procedures show negative growth. This can be seen in the graph of growth rates (calculated as log-differences):
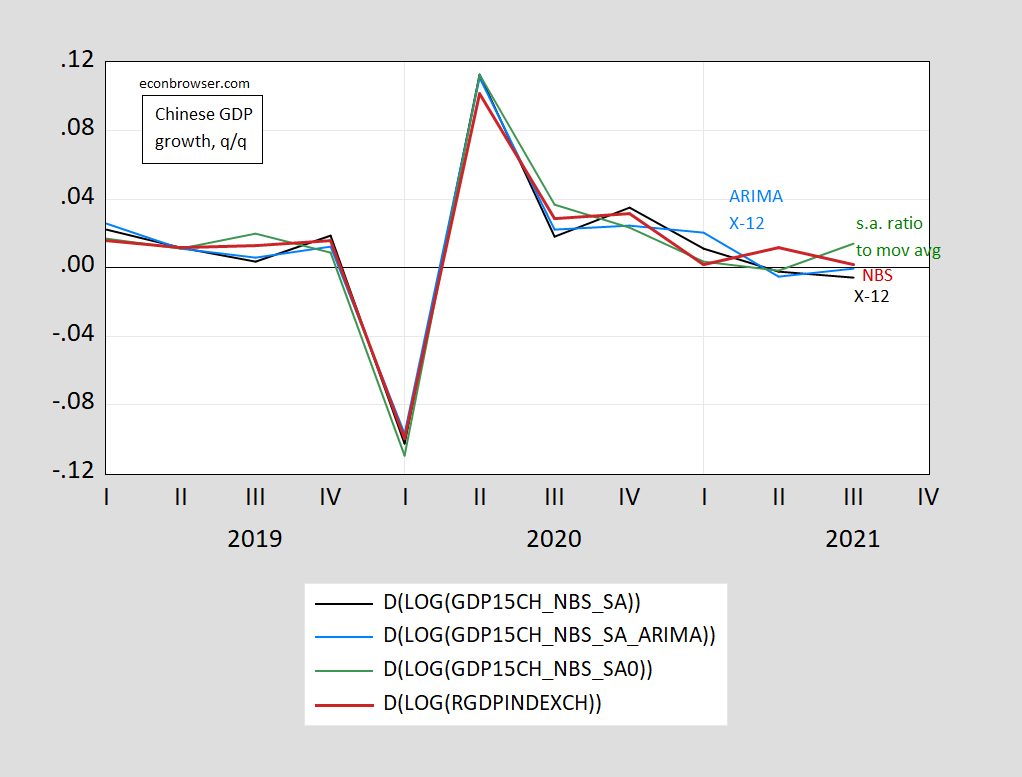
Figure 3: Quarter-on-quarter growth rates of Chinese real GDP estimated using Census X-12/seasonal X-11 (black), ARIMA Census X-12/seasonal X-11 (sky blue), ratio to moving average (green), and NBS reported q/q growth rates (red), all calculated as log-differences. Source: NBS, and author’s calculations.
Over the last two quarters, cumulative growth estimated using X-12 adjusted GDP has lagged NBS reported growth, raising the question of whether the numbers have been massaged. Some people would respond that it’s a foregone conclusion that they were. However, as noted in this post, Chinese measures of economic activity are not obviously over- or understating actual activity, particularly in recent years. Fernald, Hsu, and Spiegel (2020) [working paper version] construct a “China Cyclical Activity Tracker” (C-CAT) [see letter], and conclude:
We choose a preferred index of eight non-GDP indicators based on their fit to Chinese imports, which we call the China Cyclical Activity Tracker (or C-CAT). We find that Chinese statistics have broadly become more reliable in measuring cyclical fluctuations over time. However, measured GDP has been excessively smooth since 2013, and adds little information relative to combinations of other indicators.
The authors have done a preliminary check on the 2021Q3 GDP, using a new, unpublished quarterly version of their C-CAT (the original published version is on a 4 quarter basis). They note that using Haver data — which does not match NBS data –, reported GDP is 31 basis points (bps) below trend in standard deviation units, while their preliminary reading indicates 119 bps below trend for a preliminary reading of q-on-q estimates of the China CAT and 170 bps below trend for q-on-q estimates of a quarterly version of our “All indicators” index (both without consumer expectations, which have yet to come in for the quarter). Those preliminary results confirm the reported results in showing a slowdown for Q3, but look even a little weaker than even what non-NBS GDP series report. (Thanks to Fernald and Spiegel for their results).
(Haver’s series indicates -2.26% q/q growth SAAR, well below NBS’s -0.8%, and closer to my X-12 series (black line) above, -2.3%).
Journalistic accounts (e.g., NYT) have attributed the Q3 slowdown to the financial fallout from the Evergrande default as well as more general real estate troubles, slowed auto production due to chip shortages, and power outages/shortages.
The deceleration is important for the obvious reason that Chinese GDP now (2021) accounts for a larger share of world GDP than it did back in 2008: 17.8% vs. 7.2%; the 2021 share for the US is 24.2% (all shares calculated using US dollars at market exchange rates).
What’s the spillover effect? Ahmed et al. (2019) examine implications of a China slowdown (discussed in this post).
…the VAR estimates also suggest that the hit to economic activity in different countries and regions would generally be significant (consistent with China’s strong trade links with other economies). More specifically, the output hit to EME commodity exporters would be about ¾ as large as the hit to China itself; to other EMEs would be about half; to advanced economies excluding the United States slightly more than a third; and only a relatively modest hit to the United States. The smaller U.S. effect reflects the U.S. economy being more closed, limited direct U.S. financial linkages to China, and greater capacity at the moment (than other advanced economies, say) to ease monetary policy to cushion the blow.
The impact of a 4% shock, estimated using a SVAR, is shown below:
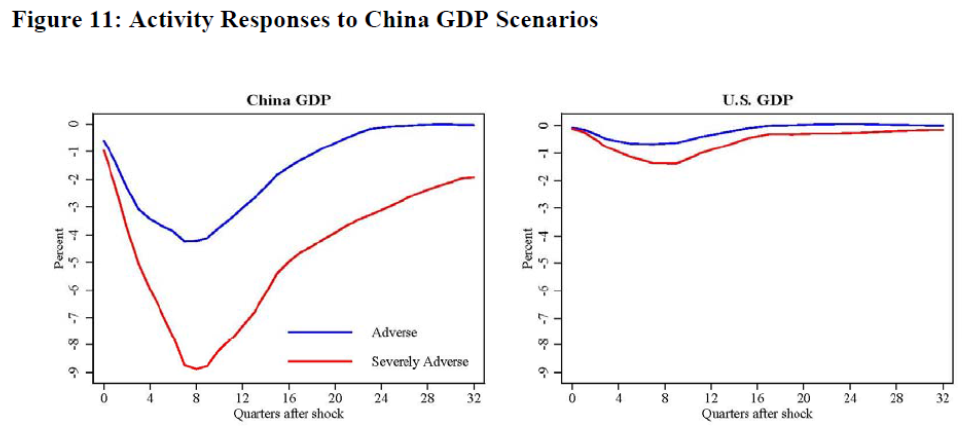
Source: Ahmed et al. (2019).
Of course, the relationships that obtained pre-pandemic are unlikely to hold fully in the current environment, but the implications are straightforward. The impact also depends on the persistence of the shock; the more long-lived the measures implemented by the Xi regime, the less likely the resumption of rapid growth (at least in the short term). In a recent op-ed, Arthur Kroeber lays out the macro challenges facing China in the context of Xi’s objectives, and hence the motivation for these regulatory measures.


Comments
Log in or sign up to join the conversation.