
Tasi Index - Elliott Wave Technical Analysis
TASI INDEX Elliott Wave Analysis Trading Lounge Day Chart
TASI INDEX Wave Technical Analysis
FUNCTION: Trend
MODE: Impulsive
STRUCTURE: Navy blue wave 1
POSITION: Gray wave 3
DIRECTION NEXT LOWER DEGREES: Navy blue wave 2
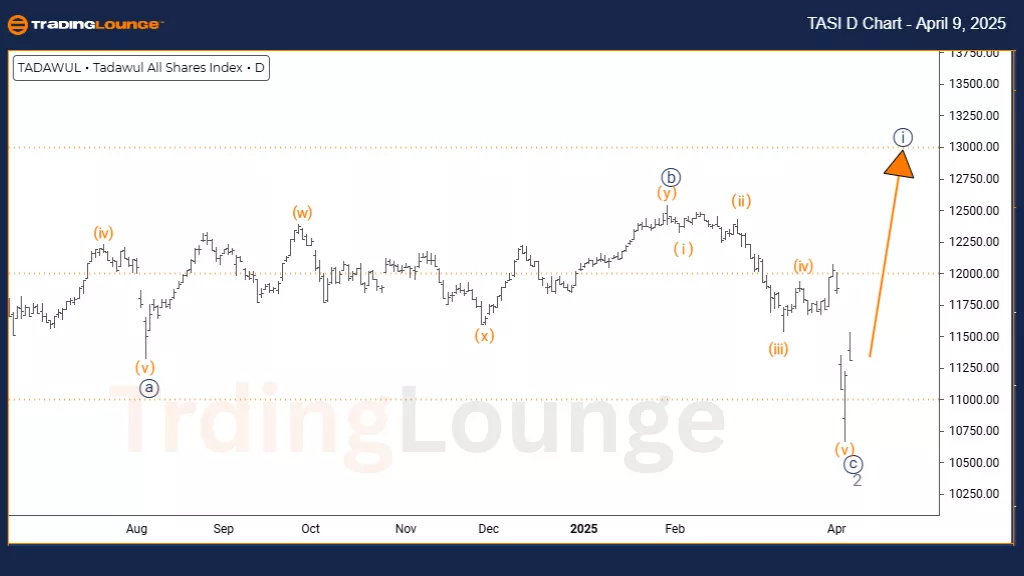
DETAILS: Gray wave 2 appears complete, with navy blue wave 1 of 3 now in progress.
The TASI INDEX Elliott Wave Analysis on the daily chart indicates a bullish scenario for the Saudi benchmark. It highlights the development of a new upward trend, with navy blue wave 1 forming part of the broader gray wave 3 structure. Following the completion of gray wave 2’s correction, the market is now advancing in the initial stages of navy blue wave 1 of 3, marking the start of a potentially significant bullish phase.
This daily chart view offers traders clear insight into the emerging impulsive wave, while situating the movement within the higher-degree structure. The forecast expects that after navy blue wave 1 finishes, a corrective navy blue wave 2 will follow, before potentially continuing higher in navy blue wave 3.
This wave structure underscores the importance of understanding degree relationships, as navy blue wave 1 provides not only a short-term trading opportunity but also contributes to the broader progression of gray wave 3. Traders should watch for key signs of a first wave, including steadily increasing momentum and volume.
The setup points to a promising environment for initiating long positions on the TASI INDEX, paired with sound risk management. This analysis offers strategic guidance for those aiming to benefit from the early stages of what may be a sustained bullish move in the Saudi market.
TASI INDEX Elliott Wave Analysis Trading Lounge Weekly Chart
TASI INDEX Wave Technical Analysis
FUNCTION: Trend
MODE: Impulsive
STRUCTURE: Navy blue wave 1
POSITION: Gray wave 3
DIRECTION NEXT LOWER DEGREES: Navy blue wave 2
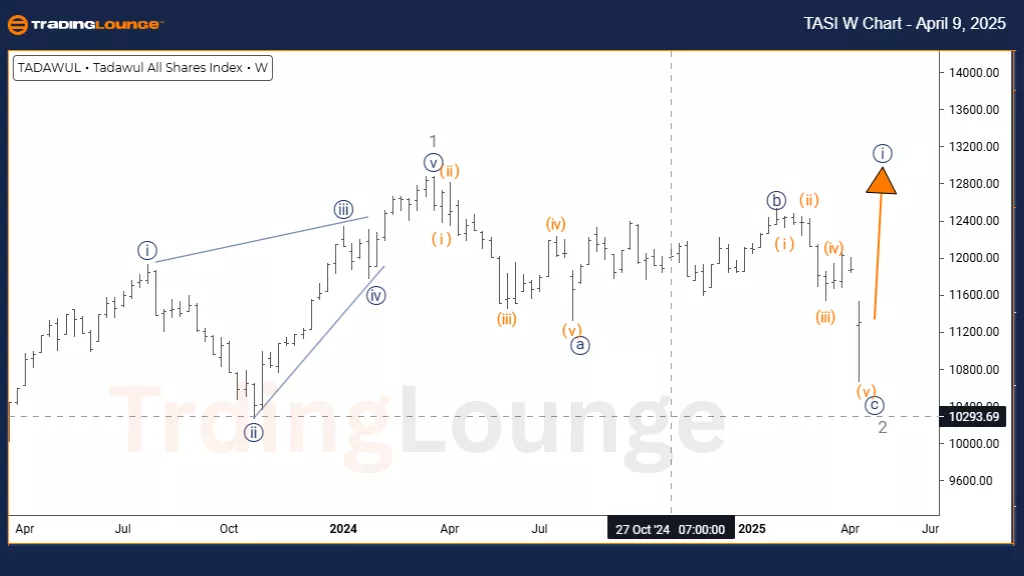
DETAILS: Gray wave 2 appears complete, and navy blue wave 1 of 3 is now in motion.
The TASI INDEX Elliott Wave Analysis on the weekly chart reveals a strong bullish setup for the Saudi benchmark. It indicates the early formation of what may evolve into a major upward trend. The analysis highlights navy blue wave 1 as the key structure within the larger gray wave 3. With gray wave 2's correction phase considered complete, the index is advancing in the initial stages of navy blue wave 1 of 3, marking a potentially significant bullish movement.
The weekly timeframe offers investors a broader view of the market’s position within the higher-degree structure, showcasing the ongoing development of navy blue wave 1 inside gray wave 3. Upon completion of navy blue wave 1, a corrective navy blue wave 2 is expected before the index continues its rise in navy blue wave 3.
This analysis stresses the significance of wave degree alignment, as navy blue wave 1 serves both as a medium-term opportunity and as a structural part of gray wave 3. Investors should look for typical first-wave traits, such as rising momentum and volume—key indicators of trend initiation. The weekly chart is particularly useful for evaluating the durability and strength of this emerging bullish move.
The current technical environment favors initiating long positions in the TASI INDEX, supported by appropriate risk controls suited to early trend phases. For position traders, the weekly chart delivers valuable insights into both near-term setups and long-term growth potential in this key Middle Eastern market.
Technical Analyst: Malik Awais
More By This Author:
Elliott Wave Technical Analysis: Ethereum Crypto Price News For Wednesday, April 9
Elliott Wave Analysis: Netflix Inc. - Tuesday, April 8
Elliott Wave Technical Analysis: British Pound/U.S. Dollar - Tuesday, April 8
At TradingLounge™, we provide actionable Elliott Wave analysis across over 200 markets. Access live chat rooms, advanced AI & algorithmic charting tools, and curated trade ...
more

