TalkMarkets Tuesday Talk: Of Stock Markets And Presidents
It remains to be seen to what extent stock markets have figured in a Biden win or a Trump loss. However as we head into the 21 day run-up to the election the Dow, S&P and the Nasdaq are all going gangbusters, or so it seems. Monday the Dow closed at 28,837, up 250 pts., the S&P 500 closed at 3,534, up 57 pts. and the Nasdaq Composite closed at 11,876, up 296 pts. Market futures for today are currently mixed.
With this in mind, below is a chart which shows how the Dow Jones Industrial Average performed at this point in time (month 45) for the last several Presidents. The y-axis shows the total percentage increase or decrease in the DJIA and the x-axis shows the term length in months. The current October value for the Dow used for this chart is 28,587.

Source: Macrotrends
Today's TalkMarkets' contributors round-up looks at market performance during this extraordinary pandemic and election year and overtime, as well as expectations for Q3 and future earnings.
Sheraz Mian in a TalkMarkets Editor's Choice article, Are Bank Stocks Cheap Or Value Traps? looks at the Banking industry and Finance sector, as well as expected returns for the S&P 500 average as a whole.
With regards to Q3 earnings Mian says, "... JPMorgan (JPM), Wells Fargo (WFC), Citigroup (C), and others that are on deck to report results this week, have only modestly recovered from their March 23 lows and now lag the broader market in a major way." Mian, who is Director of Investor Research at Zacks, illustrates this in the following chart:
.jpg)
Mian concludes his article with a look at quarterly and annual earnings and revenue growth for the entire S&P 500, which allows us to better appreciate the impact of the coronavirus pandemic. Green bars show earnings and orange bars show revenue,
.jpg)
.jpg)
Mian further notes, "The above annual growth picture approximates to an index ‘EPS’ of $127.39 for 2020, down from $159.95 in 2019 and $158.88 in 2021."
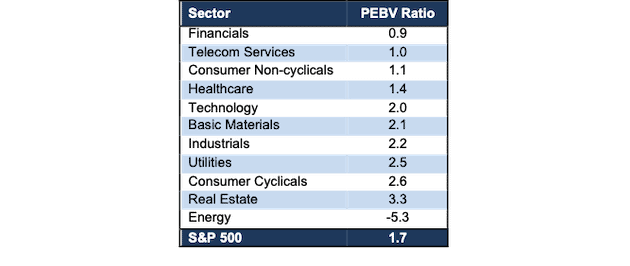
Kyle Guske in What S&P 500 Sectors Are Trading Below Economic Book Value, also an Editor's Choice pick, details the price-to-economic book value (PEBV) ratio for the S&P 500 and each of its 11 sectors.
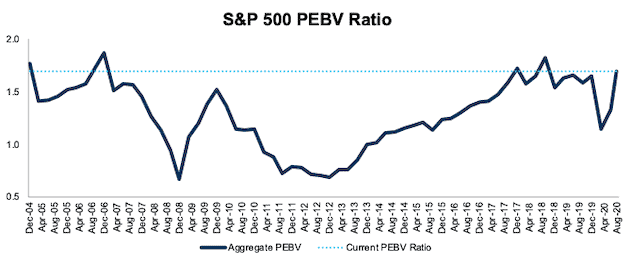
Guske writes, "The PEBV ratio for the S&P 500 rose from 1.1 at the end of 2019 to 1.7 through 2Q20, or its highest level since mid-2018, and one of the highest levels since 2004. This ratio measures the level of expectations for future profits compared to existing profit. At 1.7, the S&P 500’s valuation implies the profits of the S&P 500 will increase 70% from current levels."
Figure 1 in his article (shown below) charts the PEBV ratio from Dec. 2004 to Aug. 11, 2020, for the entire S&P 500.

It is worth delving into the article to review the historical PEBVs by sector. Guske also includes the following PEBV Ratio table as of 8/11/20 by Sector.

In World GDP Lost Due To Coronavirus Reaches $12 Trillion, Ironman writes that this number (as of 9/20) could represent the bottom for economic losses due to COVID-19:
" that estimate is based upon the trailing twelve month average for the year over year change in the concentration of atmospheric carbon dioxide measured monthly at the remote Mauna Loa Observatory. Since originating in China in December 2019, the pace at which CO₂ accumulates in the Earth's air has fallen from 2.91 parts per million to a preliminary estimate of 2.55 parts per million in September 2020 as the economic impact of the pandemic has registered across the globe.
The good news is that September 2020 initially appears to mark a bottom for the global coronavirus recession in the absence of any additional widespread government-mandated, economy-crushing lockdown measures."
Ironman illustrates this in the attached chart:

Jill Mislinski in her article, World Markets Update: Monday, Oct. 12, shows us in graphic terms how markets have faired this year and over time. Be sure to check out the complete article to get the historical perspective. Below is a chart of the y-t-d performance of global stock exchanges.

Seems that Mumbai and Tokyo have a chance at ending the year in the green too, not sure about the others.
Rounding out the column where we began, Bob Lang, in How Will The Stock Market React To The Election?, has the following takes on the topic.
"As we know, markets hate uncertainty...As I’ve written recently, market volatility has been on the rise, and worries over post-election chaos has been priced in."
"Is it fair to price in a big move when it is unlikely to occur? Yes, I said it’s unlikely to occur. Markets seemed to have overpriced fear and ramifications against the market...As we’ve seen over the past couple of weeks, fear is slowing leaking out and the consequence is a higher stock market. This is not about valuation or fundamentals, rather just a condition that needs to be corrected."

And this one.
"If the markets were truly concerned about the election, the economy, the pandemic, etc., would buyers have stepped up? Would volatility fall sharply? Here’s what I’m thinking: a benign response to the election may result in a mammoth rally to end 2020 sharply higher."
A few months back I closed this column entreating readers to "WAM" (Wear a Mask), SciLine has been asking doctors and scientists about COVID-19; in response to the question, "What else do you think the American public should know about COVID-19 vaccine development?", Paul Offit, MD, Professor of Vaccinology and Pediatrics, Perelman School of Medicine at the University of Pennsylvania, Director of the Vaccine Education Center at Children's Hospital of Philadelphia, replied as follows:
Please keep that in mind and have a good week.


Of course things are rising, the graphs always do that. Is it because things are actually getting better or is it because of the federal bank stoking the fire of inflation by flinging cash all over??
And the one certified GOOD piece of information is that everyone should keep wearing their masks.