

Image Source: Unsplash
It is a holiday in the US on Monday, June 20, and the stock market is closed that day. Market health remains poor. I am not taking long swing trades until we start to see an improvement. How market health is assessed (for swing trading) is discussed below.
I was participating in some oil stocks, but I was back to 100% cash as of early June. Many of those oil charts were decimated last week with big drops. So at the moment, there is no place to hide. I’m staying in cash and awaiting better opportunities.
Many #oil stocks are now violating 1 of my major swing trading rules: don't buy if this correction is much larger (%) than prior corrections (%) in the uptrend.
— Cory Mitchell, CMT (@corymitc) June 18, 2022
Mark up on $DOCU shows. $XLE biggest drop since Oct.
Some oil stocks may still have good setups. But many are broken. pic.twitter.com/Yr6RtltZFN
Being aware of bigger drops has saved me a lot of money in the past, and is one of the critical things to watch for, as discussed in the Complete Method Stock Swing Trading Course. It’s crucial to not only have strategies, but to also have guidelines for when those strategies are traded, and when they are not.
I also wanted to touch on investment vs. swing trading. Know your approach with each and don’t mix them up.
I swing trade stocks & in that account I'm not buying right now.
— Cory Mitchell, CMT (@corymitc) June 13, 2022
For my passive #investing account I continue to accumulate for the long-term hold. Buy at steady intervals & reap the compounding effect of 10%/year over the long run.https://t.co/XvvdYzX53E
For my long-term buy-and-hold account I regularly buy index ETFs. The market moving up and down doesn’t change that. The goal of that account is to simply to get close to the 9% to 10% per year average the stock market has produced over the last 150 years. There is a clear strategy discussed in the Passive Investing eBook.
This is not to be confused with swing trading, which is actively buying and selling for quicker profits and hopefully much higher returns. I stay out when conditions are unfavorable (now) and try to capitalize heavily when conditions are favorable. If you invest and swing trade, have strategies for both approaches.
How the Market Indexes Are Doing
I look at 4 different US indices because they each tell a different story about overall stock market health. The stock market is healthiest, and swing trading stocks on the long side is most profitable, when all these indexes are in uptrends. Here’s what each of the 4 indices represents:
- Nasdaq 100 – Tech stocks.
- S&P 500 – Large US companies.
- NYSE Composite – A wide array of stocks, varying in size and industry.
- Russell 2000 – Smaller companies.
2 Canadian stock indices are also included. The Composite tracks larger companies, while the Venture tracks very small companies.

Charts are provided by TradingView – these are charts I personally use.
There's not much to say here, all indices are in downtrends and near lows. When the stock market turns around, there will be plenty of opportunities to profit. No need to try to pick the bottom to be the first one in.
State of the Market Health Indicators
The following chart shows the market health indicators I track. They tell me the condition of the stock market overall, and whether it’s a good time to swing trade individual stocks.
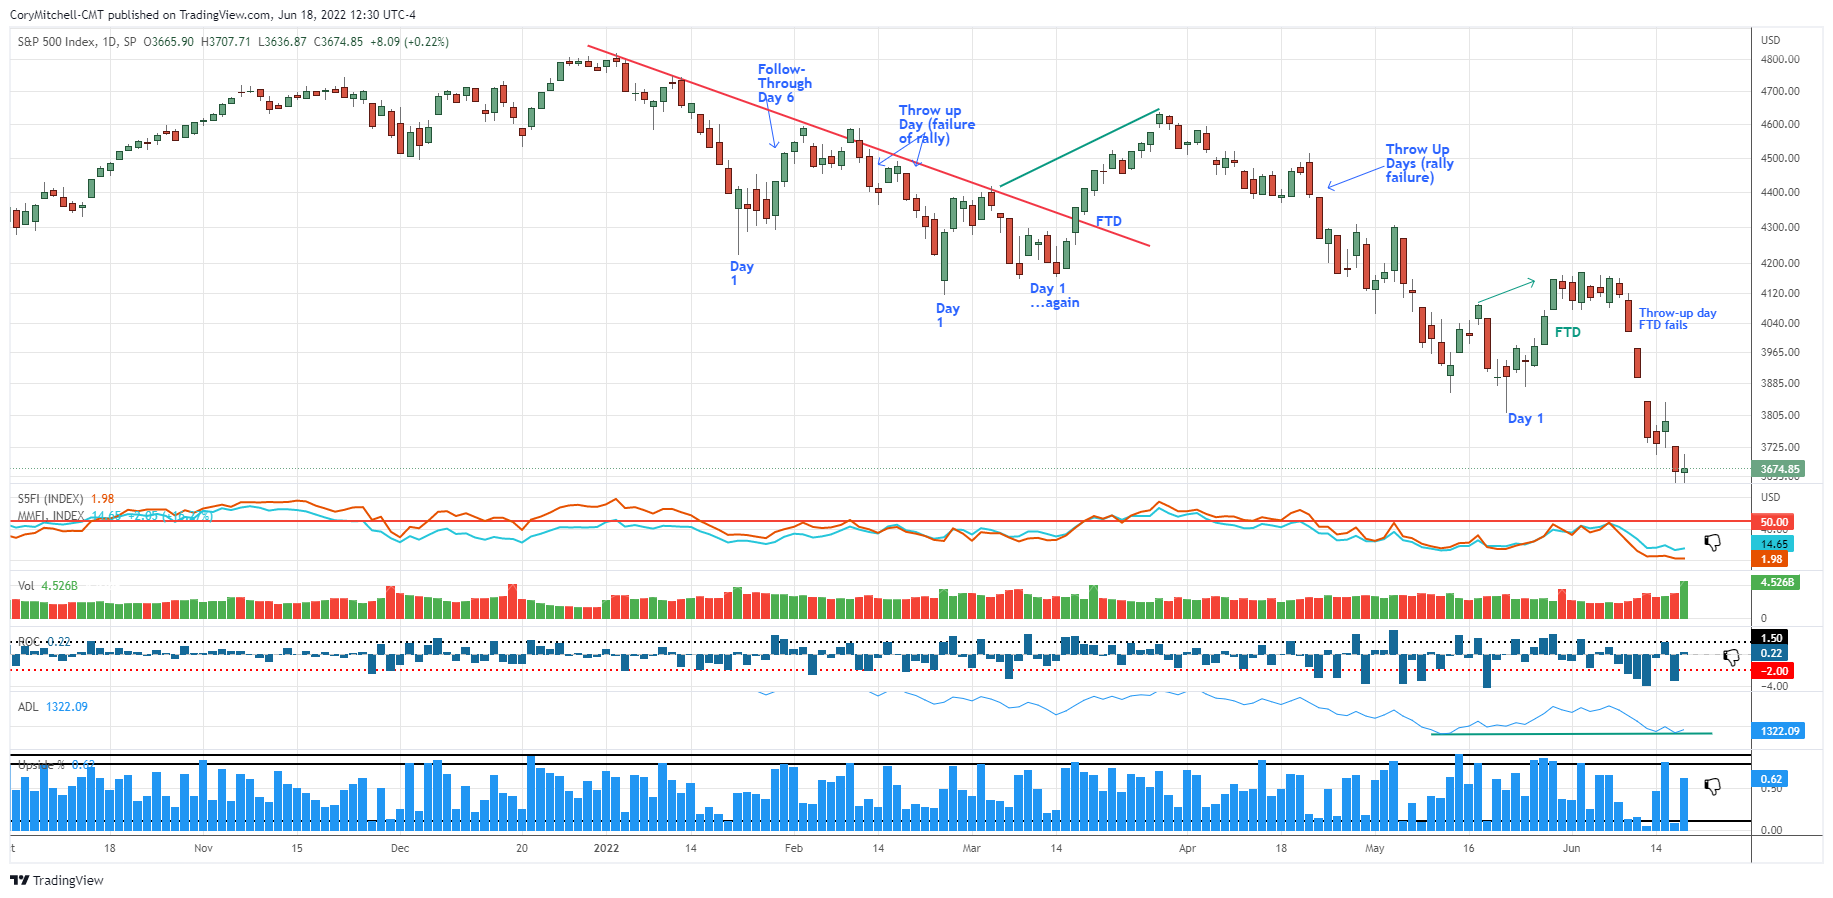
The market health indicators were trying to improve, but they turned poor over the last few days.
- 2% of S&P 500 stocks are above their respective 50-day moving averages. 15% of all US stocks are above their respective 50-day moving averages. It’s generally much easier to swing trade profitably (on the long side) when more stocks are above their 50-day averages. When this indicator is below 50%, it tends to be sideways or a downtrend for most stocks/indexes.
- Volume is not currently important for my purposes.
- The dark blue bars are the daily percentage movement of the S&P 500. Big moves are associated with downtrends and turning points. Small values are associated with an uptrend. Values of -2 are a warning sign anytime they occur. June 9, 10, 13, and 16 saw drops greater than -2%.
- The blue line is the cumulative NYSE Advance-Decline Line. It is currently showing a positive divergence in that it is currently holding above its prior low (green line) while the S&P 500 has made a lower low over that time frame.
- The columns of blue are NYSE up volume divided by NYSE total volume. It tracks buying and selling enthusiasm. Levels below 10% and above 90% are important (or back-to-back days above 80%). There was a 96% downside day on June 13 and a 92% downside day on June 16.
- The ultimate indicator is how many quality setups there are and how trades are working. I ran a quick scan and there was almost nothing on it. So there are few quality setups, and any recent breakouts likely failed. Therefore, it's not a great time to be taking long swing trades.
What I’m Doing Right Now
I'm not taking long swing trades right now. I am day trading, as always. There is a lot of movement and opportunity when day trading stocks, but I primarily day trade the EUR/USD currency pair every morning for one to two hours. There is a lot of potential there, as well.
Take the time to refine your strategies while the market is weak. Don’t let the time go to waste.


Comments
Log in or sign up to join the conversation.