

ESKOM WOES INTENSIFY DRIVING USD/ZAR HIGHER
The US Dollar is showing no reprieve for the South African Rand as the safe-haven appeal of the greenback and a hawkish Federal Reserve continues to support USD strength.
With USD/ZAR currently threatening Oct 2020 levels, South Africa’s recent inflation data followed the likes of the US, Europe and other major economies as CPI (Consumer Price Index) rose to it’s highest level since 2017 (6.5%) , breaching the upper bound of the Reserve Bank’s target of 3 – 6%.
As the SARB (South African Reserve Bank) cautiously considers increasing interest rates at a more aggressive pace, the outlook for the commodity rich country looks a lot more pessimistic as electricity outages, high unemployment and lack of accountability dampen sentiment.
For over a decade, Eskom (South Africa’s national electricity provider) has implemented load shedding (nation-wide power outages) in an effort to reduce the pressure on poorly maintained and aging power plants. 10 years later and Eskom woes have intensified, resulting in thousands of hours of wasted productivity.
With the FOMC minutes and US employment data (Non-Farm Payrolls) on this week’s agenda, the ZAR could remain under pressure alongside other EM currencies.
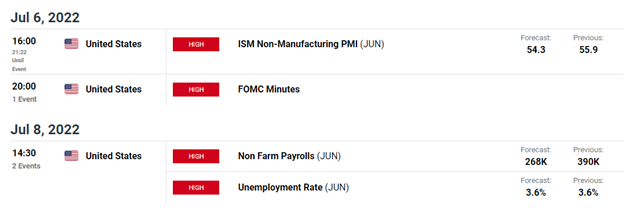
DailyFX Economic Calendar
At the time of writing, USD is trading higher against a list of emerging markets including the Turkish Lira (TRY), Mexican Peso (MXN), the Chinese Yuan (CNH) and the South African Rand (ZAR).
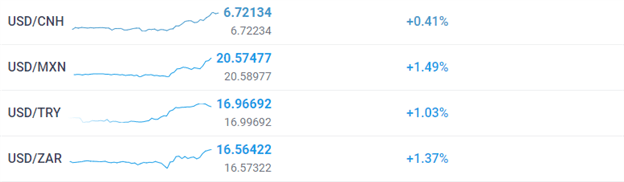
Daily FX Forex Rates
From a technical standpoint, the weekly chart below illustrates the manner in which Fibonacci levels from two historical moves continue to come into play. With the 76.4% retracement of the 2012 – 2020 move and the 23.6% Fib of the 2016 – 2018 move forming a zone of confluency between 16,329 and 16,527, this narrow zone will likely continue to provide both support and resistance for the longer-term move.
USD/ZAR Weekly Chart
(Click on image to enlarge)
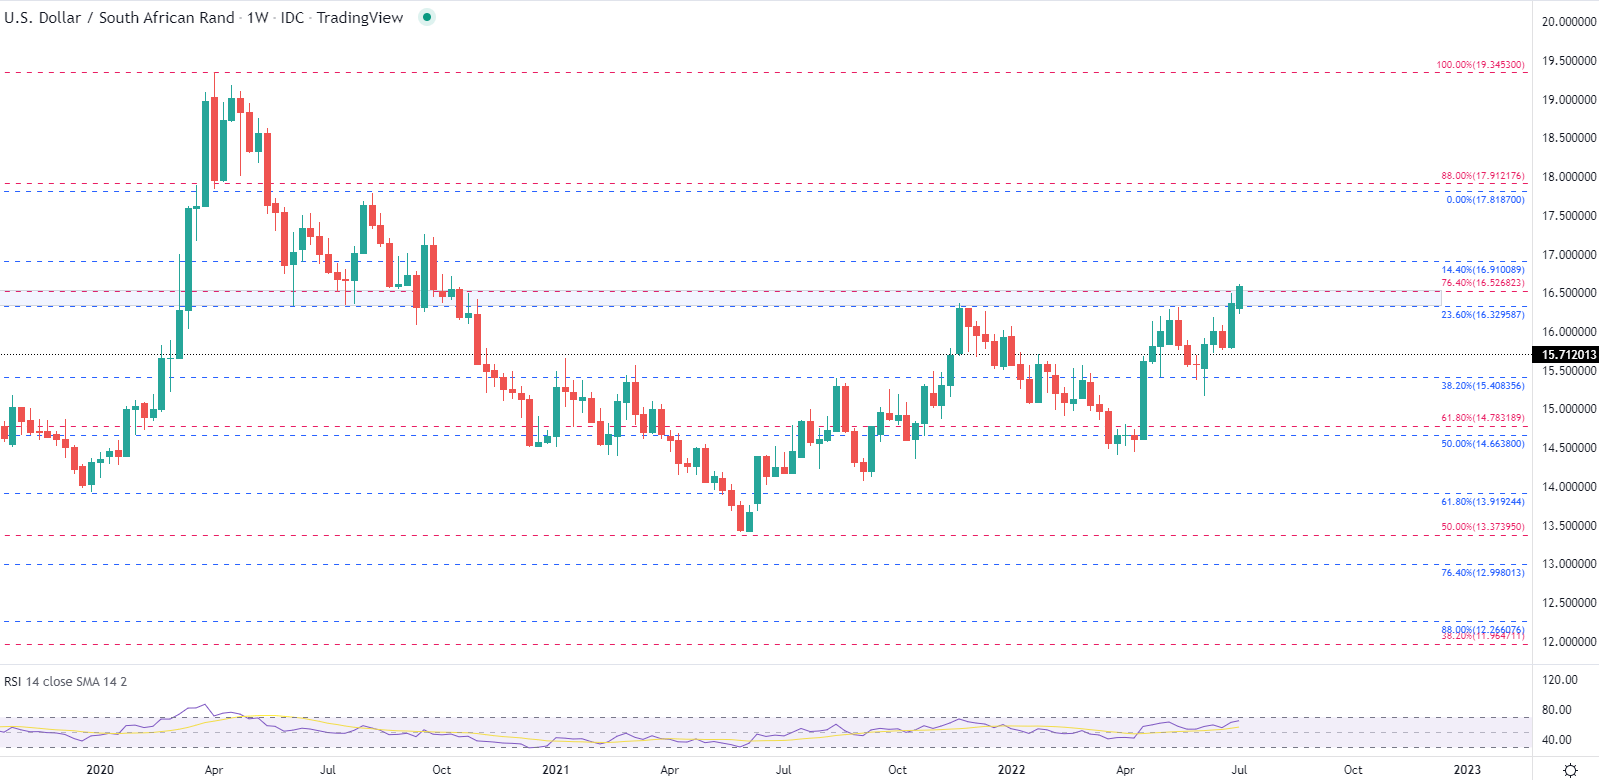
Chart prepared by Tammy Da Costa using TradingView
If we take a closer look at the daily chart and include the October 2020 – June 2021 move, a hold above 16,52 could see USD/ZAR retesting the Oct 2020 high at 16,796, raising the prospects for a drive back to the 14.4% Fib at 16,91. Meanwhile, the RSI (Relative Strength Index) has edged higher, threatening oversold territory.
USD/ZAR Daily Chart
(Click on image to enlarge)
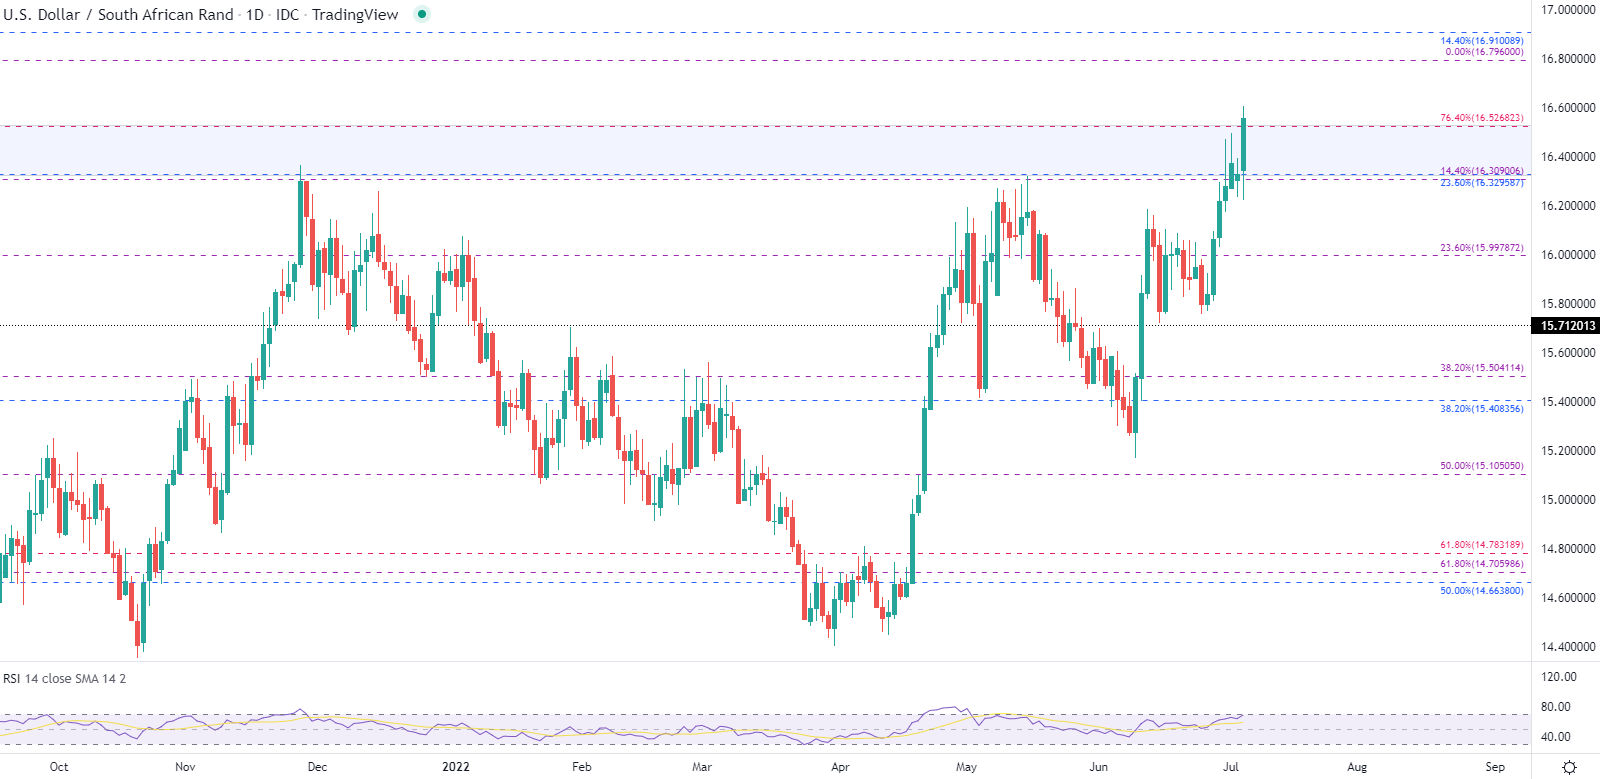
Chart prepared by Tammy Da Costa using TradingView
More By This Author:
US Dollar Price Action Setups: USD/CAD, GBP/USD, EUR/USD, USD/JPY
Crude Oil Update: Brent Tailwinds Outweighed By Recessionary Fears
Bitcoin Price Analysis: BTC/USD Grapples with Support Ahead of FOMC


Comments
Log in or sign up to join the conversation.