

Here are the latest charts and statistics for the Commitment of Traders (COT) data published by the Commodities Futures Trading Commission (CFTC).
The latest COT data is updated through Tuesday, July 5th and shows a quick view of how large traders (for-profit speculators and commercial entities) were positioned in the futures markets.
COT Metals market speculator bets were overall lower this week as just one out of the six metals markets we cover had higher positioning this week while the other five markets had lower contracts. The only precious metals market to have higher speculator bets this week was Palladium with a rise of just 415 contracts. Meanwhile, leading the declines in speculator bets this week were Gold (-12,033 contracts) and Silver (-5,752 contracts) with Platinum (-1,428 contracts) and Copper (-1,100 contracts) also having lower bets for the week.
Highlights of the Metals data:
- Gold speculators bets have dropped for the past two straight weeks and for nine out of the past twelve weeks. These declines have taken a total of -108,627 contracts off the Gold bullish position in past twelve weeks
- Current Gold speculator position has fallen to lowest level since May 28th of 2019, a span of 162 weeks
- Silver bets have dropped in nine out of the past eleven weeks (for a total decrease of -41,290 contracts)
- Silver speculator positions have now fallen to the lowest level in 160 weeks, dating back to June 11th of 2019
- Copper speculator positions are in bearish territory for an 11th straight week and speculator bets have fallen by a total of -67,938 contracts since April 5th
- Copper speculator bets have decreased to the lowest level (currently at -31,796 contracts) in the past 120 weeks, dating back to March 17th of 2020

Strength scores (measuring the 3-Year range of Speculator positions, from 0 to 100 where above 80 is extreme bullish and below 20 is extreme bearish) show that the speculator sentiment for all of the precious metals is near or at the bottom of each of their 3-year ranges. The highest strength score currently is for Copper (19.5 percent) which is in an extreme bearish level for the past three years (under 20 percent). All the other markets also are in extreme bearish levels as well with Gold, Silver and Platinum residing at 3-year lows of 0 percent each.

Strength score trends (or move index, that calculate 6-week changes in strength scores) shows that Gold (-18.3 percent), Silver (-12.3 percent) and Copper (-8.8 percent) are leading the scores to the downside over the past six weeks followed by Platinum (-6.0 percent). Palladium (0.3 percent) is the only precious metals with a positive score although it is barely positive.
Data Snapshot of Commodity Market Traders | Columns Legend
| WTI Crude | 1,637,862 | 0 | 280,523 | 0 | -304,217 | 100 | 23,694 | 48 |
| Corn | 1,331,035 | 0 | 260,705 | 63 | -207,441 | 42 | -53,264 | 12 |
| Natural Gas | 977,507 | 0 | -130,519 | 39 | 91,950 | 60 | 38,569 | 71 |
| Sugar | 713,245 | 0 | 83,512 | 54 | -85,255 | 52 | 1,743 | 10 |
| Soybeans | 638,675 | 7 | 125,491 | 52 | -93,638 | 56 | -31,853 | 17 |
| Gold | 498,210 | 13 | 145,660 | 0 | -165,585 | 100 | 19,925 | 0 |
| Wheat | 288,754 | 0 | 8,384 | 30 | 623 | 61 | -9,007 | 64 |
| Heating Oil | 264,269 | 21 | 6,486 | 52 | -22,775 | 47 | 16,289 | 55 |
| Coffee | 193,731 | 1 | 46,787 | 79 | -49,139 | 25 | 2,352 | 14 |
| Copper | 183,331 | 15 | -31,796 | 19 | 31,340 | 81 | 456 | 28 |
| Brent | 166,711 | 13 | -38,514 | 47 | 37,309 | 55 | 1,205 | 26 |
| Silver | 140,463 | 7 | 5,139 | 0 | -11,622 | 100 | 6,483 | 0 |
| Platinum | 72,895 | 44 | -2,734 | 0 | -1,670 | 100 | 4,404 | 23 |
| Palladium | 7,373 | 5 | -3,410 | 4 | 4,104 | 98 | -694 | 4 |
Gold Comex Futures:
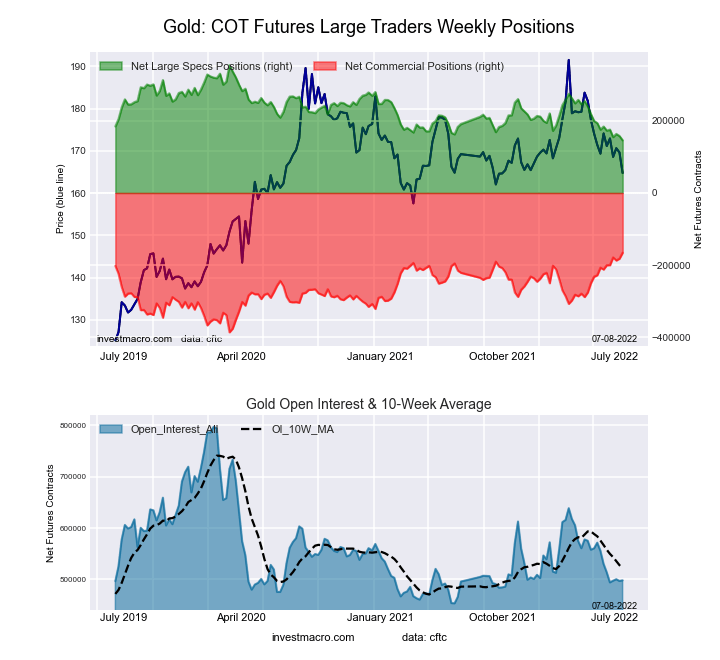
The Gold Comex Futures large speculator standing this week totaled a net position of 145,660 contracts in the data reported through Tuesday. This was a weekly decline of -12,033 contracts from the previous week which had a total of 157,693 net contracts.
This week’s current strength score (the trader positioning range over the past three years, measured from 0 to 100) shows the speculators are currently Bearish-Extreme with a score of 0.0 percent. The commercials are Bullish-Extreme with a score of 100.0 percent and the small traders (not shown in chart) are Bearish-Extreme with a score of 0.5 percent.
| Gold Futures Statistics | SPECULATORS | COMMERCIALS | SMALL TRADERS |
| – Percent of Open Interest Longs: | 53.8 | 23.7 | 8.8 |
| – Percent of Open Interest Shorts: | 24.5 | 57.0 | 4.8 |
| – Net Position: | 145,660 | -165,585 | 19,925 |
| – Gross Longs: | 267,806 | 118,289 | 43,933 |
| – Gross Shorts: | 122,146 | 283,874 | 24,008 |
| – Long to Short Ratio: | 2.2 to 1 | 0.4 to 1 | 1.8 to 1 |
| NET POSITION TREND: | |||
| – Strength Index Score (3 Year Range Pct): | 0.0 | 100.0 | 0.5 |
| – Strength Index Reading (3 Year Range): | Bearish-Extreme | Bullish-Extreme | Bearish-Extreme |
| NET POSITION MOVEMENT INDEX: | |||
| – 6-Week Change in Strength Index: | -18.3 | 21.1 | -29.3 |
Silver Comex Futures:
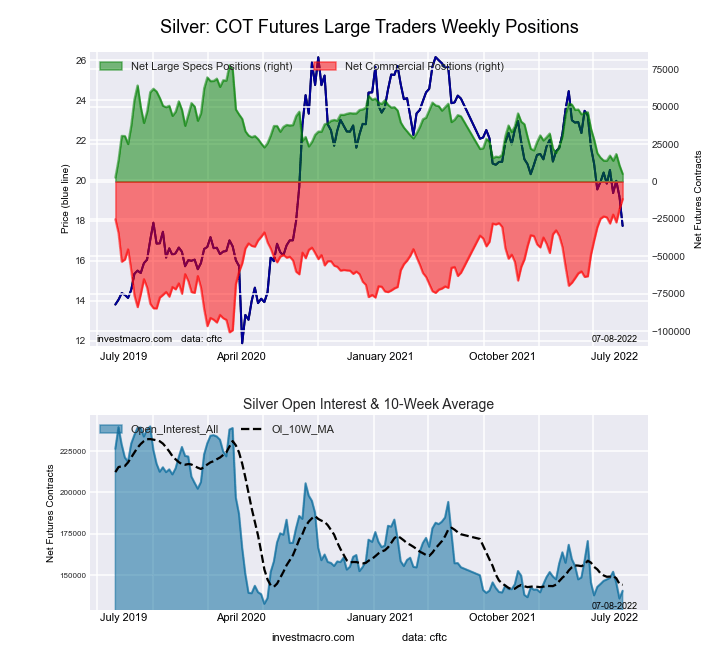
The Silver Comex Futures large speculator standing this week totaled a net position of 5,139 contracts in the data reported through Tuesday. This was a weekly reduction of -5,752 contracts from the previous week which had a total of 10,891 net contracts.
This week’s current strength score (the trader positioning range over the past three years, measured from 0 to 100) shows the speculators are currently Bearish-Extreme with a score of 0.0 percent. The commercials are Bullish-Extreme with a score of 100.0 percent and the small traders (not shown in chart) are Bearish-Extreme with a score of 0.0 percent.
| Silver Futures Statistics | SPECULATORS | COMMERCIALS | SMALL TRADERS |
| – Percent of Open Interest Longs: | 39.0 | 40.0 | 16.0 |
| – Percent of Open Interest Shorts: | 35.4 | 48.2 | 11.4 |
| – Net Position: | 5,139 | -11,622 | 6,483 |
| – Gross Longs: | 54,841 | 56,137 | 22,495 |
| – Gross Shorts: | 49,702 | 67,759 | 16,012 |
| – Long to Short Ratio: | 1.1 to 1 | 0.8 to 1 | 1.4 to 1 |
| NET POSITION TREND: | |||
| – Strength Index Score (3 Year Range Pct): | 0.0 | 100.0 | 0.0 |
| – Strength Index Reading (3 Year Range): | Bearish-Extreme | Bullish-Extreme | Bearish-Extreme |
| NET POSITION MOVEMENT INDEX: | |||
| – 6-Week Change in Strength Index: | -12.3 | 13.1 | -13.2 |
Copper Grade #1 Futures:
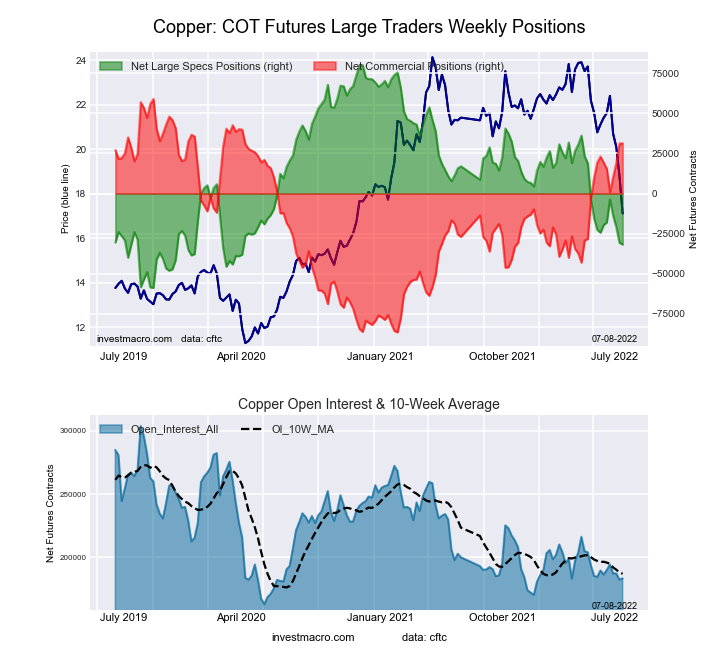
The Copper Grade #1 Futures large speculator standing this week totaled a net position of -31,796 contracts in the data reported through Tuesday. This was a weekly reduction of -1,100 contracts from the previous week which had a total of -30,696 net contracts.
This week’s current strength score (the trader positioning range over the past three years, measured from 0 to 100) shows the speculators are currently Bearish-Extreme with a score of 19.5 percent. The commercials are Bullish-Extreme with a score of 81.0 percent and the small traders (not shown in chart) are Bearish with a score of 27.9 percent.
| Copper Futures Statistics | SPECULATORS | COMMERCIALS | SMALL TRADERS |
| – Percent of Open Interest Longs: | 29.5 | 51.7 | 8.5 |
| – Percent of Open Interest Shorts: | 46.8 | 34.6 | 8.2 |
| – Net Position: | -31,796 | 31,340 | 456 |
| – Gross Longs: | 54,073 | 94,749 | 15,516 |
| – Gross Shorts: | 85,869 | 63,409 | 15,060 |
| – Long to Short Ratio: | 0.6 to 1 | 1.5 to 1 | 1.0 to 1 |
| NET POSITION TREND: | |||
| – Strength Index Score (3 Year Range Pct): | 19.5 | 81.0 | 27.9 |
| – Strength Index Reading (3 Year Range): | Bearish-Extreme | Bullish-Extreme | Bearish |
| NET POSITION MOVEMENT INDEX: | |||
| – 6-Week Change in Strength Index: | -8.8 | 8.3 | 0.6 |
Platinum Futures:
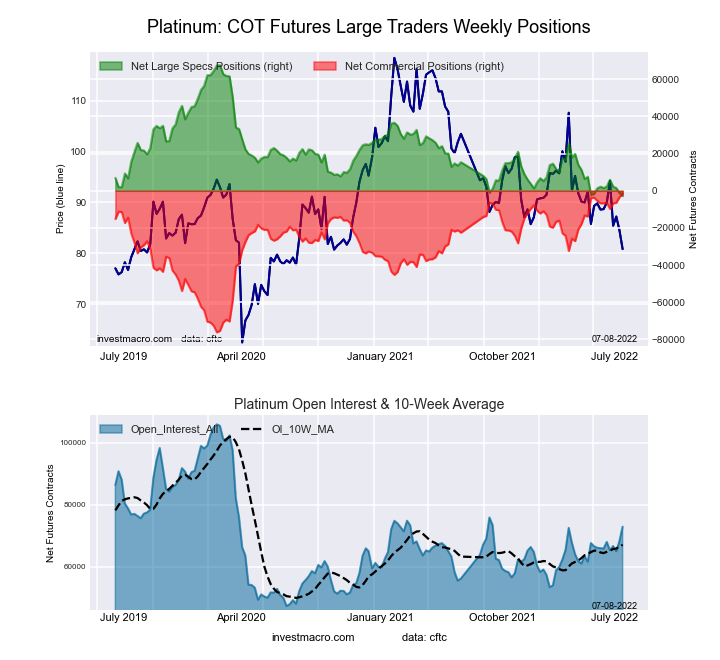
The Platinum Futures large speculator standing this week totaled a net position of -2,734 contracts in the data reported through Tuesday. This was a weekly reduction of -1,428 contracts from the previous week which had a total of -1,306 net contracts.
This week’s current strength score (the trader positioning range over the past three years, measured from 0 to 100) shows the speculators are currently Bearish-Extreme with a score of 0.0 percent. The commercials are Bullish-Extreme with a score of 100.0 percent and the small traders (not shown in chart) are Bearish with a score of 23.4 percent.
| Platinum Futures Statistics | SPECULATORS | COMMERCIALS | SMALL TRADERS |
| – Percent of Open Interest Longs: | 43.8 | 38.6 | 11.9 |
| – Percent of Open Interest Shorts: | 47.5 | 40.9 | 5.9 |
| – Net Position: | -2,734 | -1,670 | 4,404 |
| – Gross Longs: | 31,920 | 28,155 | 8,693 |
| – Gross Shorts: | 34,654 | 29,825 | 4,289 |
| – Long to Short Ratio: | 0.9 to 1 | 0.9 to 1 | 2.0 to 1 |
| NET POSITION TREND: | |||
| – Strength Index Score (3 Year Range Pct): | 0.0 | 100.0 | 23.4 |
| – Strength Index Reading (3 Year Range): | Bearish-Extreme | Bullish-Extreme | Bearish |
| NET POSITION MOVEMENT INDEX: | |||
| – 6-Week Change in Strength Index: | -6.0 | 6.7 | -11.1 |
Palladium Futures:
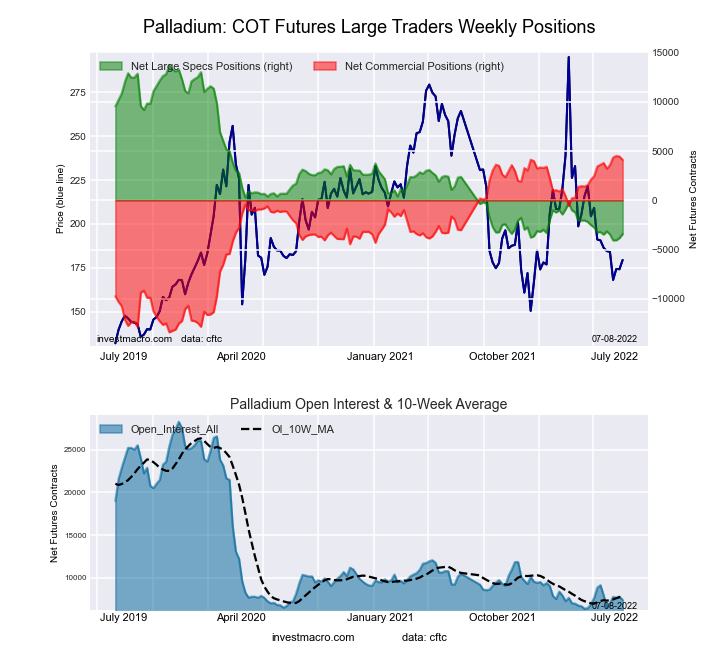
The Palladium Futures large speculator standing this week totaled a net position of -3,410 contracts in the data reported through Tuesday. This was a weekly gain of 415 contracts from the previous week which had a total of -3,825 net contracts.
This week’s current strength score (the trader positioning range over the past three years, measured from 0 to 100) shows the speculators are currently Bearish-Extreme with a score of 3.6 percent. The commercials are Bullish-Extreme with a score of 97.7 percent and the small traders (not shown in chart) are Bearish-Extreme with a score of 3.7 percent.
| Palladium Futures Statistics | SPECULATORS | COMMERCIALS | SMALL TRADERS |
| – Percent of Open Interest Longs: | 15.4 | 73.1 | 11.2 |
| – Percent of Open Interest Shorts: | 61.6 | 17.4 | 20.6 |
| – Net Position: | -3,410 | 4,104 | -694 |
| – Gross Longs: | 1,132 | 5,389 | 825 |
| – Gross Shorts: | 4,542 | 1,285 | 1,519 |
| – Long to Short Ratio: | 0.2 to 1 | 4.2 to 1 | 0.5 to 1 |
| NET POSITION TREND: | |||
| – Strength Index Score (3 Year Range Pct): | 3.6 | 97.7 | 3.7 |
| – Strength Index Reading (3 Year Range): | Bearish-Extreme | Bullish-Extreme | Bearish-Extreme |
| NET POSITION MOVEMENT INDEX: | |||
| – 6-Week Change in Strength Index: | 0.3 | 1.7 | -21.2 |
*COT Report: The COT data, released weekly to the public each Friday, is updated through the most recent Tuesday (data is 3 days old) and shows a quick view of how large speculators or non-commercials (for-profit traders) were positioned in the futures markets.
The CFTC categorizes trader positions according to commercial hedgers (traders who use futures contracts for hedging as part of the business), non-commercials (large traders who speculate to realize trading profits) and nonreportable traders (usually small traders/speculators) as well as their open interest (contracts open in the market at time of reporting).See CFTC criteria here.
More By This Author:
COT Week 25 Charts: Bond Market Speculator Bets Rose This Week Led By 5-Year & 2-Year Bonds
COT Week 25 Charts: Metals Speculator Bets Slightly Higher As Gold & Silver Bets Gain
Currency Speculators Boost Japanese Yen Bets To 15-Week High While Canadian Dollar Bets Drop Sharply


Comments
Log in or sign up to join the conversation.