
Nifty 50 Index - Elliott Wave Technical Forecast
NIFTY 50 INDEX – Elliott Wave Analysis – Trading Lounge Day Chart
NIFTY 50 Index – Wave Technical Analysis
FUNCTION: Bullish Trend
MODE: Impulsive
STRUCTURE: Orange Wave 3
POSITION: Navy Blue Wave 1
DIRECTION (NEXT HIGHER DEGREES): Orange Wave 3 (initiated)
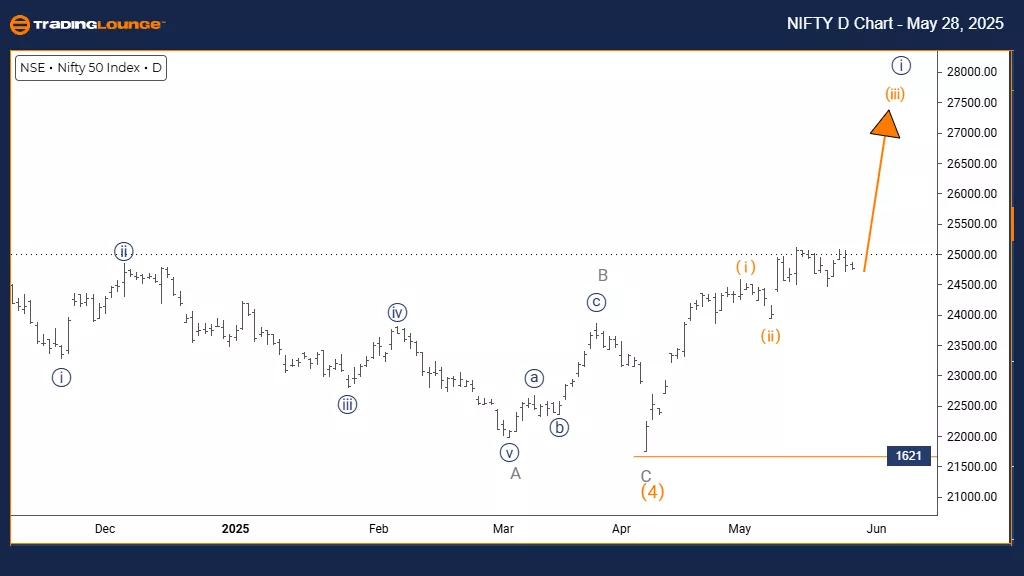
DETAILS: With orange wave 2 completed, orange wave 3 is now in progress.
Wave Cancel Invalid Level: 1621
The daily analysis of the Nifty 50 Index indicates strong bullish momentum as part of an ongoing upward trend. Orange wave 3 is actively developing within a larger impulsive pattern, identified as navy blue wave 1. This structure implies that orange wave 2 has ended and the index has entered the most dynamic phase of the Elliott Wave impulse sequence.
The transition from wave 2 to wave 3 is confirmed, reflecting notable buying activity and trend strength. With the current movement nested in navy blue wave 1, the market outlook remains strongly bullish, with expectations for continued upward movement. A critical invalidation level is set at 1621; a drop below this point would require a reassessment of the wave structure and may indicate a deeper correction or a trend change.
This framework provides investors with clear insight into the Nifty 50’s market positioning. The setup suggests the potential for accelerated gains during this current wave, representing a key growth phase within the broader uptrend. The next move in higher degrees involves further development of orange wave 3 under the navy blue wave 1 umbrella.
Traders should watch for continuation signals within wave 3 and monitor the 1621 level as critical support. Holding above this threshold keeps the bullish scenario intact and supports the outlook for more gains in the near term.
NIFTY 50 INDEX – Elliott Wave Analysis – Trading Lounge Weekly Chart
NIFTY 50 Index – Wave Technical Analysis
FUNCTION: Bullish Trend
MODE: Impulsive
STRUCTURE: Navy Blue Wave 1
POSITION: Gray Wave 1
DIRECTION (NEXT HIGHER DEGREES): Navy Blue Wave 1 (initiated)
DETAILS: Orange wave 4 is likely complete; navy blue wave 1 of gray wave 1 is now underway.
Wave Cancel Invalid Level: 1621
The weekly chart of the Nifty 50 Index reflects a bullish market outlook supported by strong impulsive traits in its current wave formation. Navy blue wave 1 is developing within the larger bullish framework of gray wave 1. This marks the end of orange wave 4’s corrective action and the beginning of a new upward phase.
This transition from wave 4 to wave 1 signals renewed bullish strength. The impulsive advance points to institutional interest and accumulation, which are commonly observed in early-stage bullish movements. With the weekly timeframe in view, this structure hints at the potential for an extended upward trend. An important support level has been identified at 1621; a drop below this point would invalidate the current wave scenario and suggest a need to reassess the technical picture.
For long-term investors, this chart provides a solid technical basis for understanding the Nifty 50’s place within a broader bullish cycle. Navy blue wave 1 represents the opening segment of gray wave 1, suggesting more upside in the future. The next phase in higher degrees involves the continued development of navy blue wave 1 within this bullish expansion.
Market watchers should keep an eye on price action for confirmation of the ongoing impulse while carefully monitoring the 1621 invalidation level. A sustained move above this level supports the current bullish setup, while any breach may point to emerging weakness. The weekly perspective underscores the strength and potential longevity of this new upward phase in the Indian equity markets.

Technical Analyst: Malik Awais
More By This Author:
Elliott Wave Technical Analysis: Australian Dollar/Japanese Yen - Wednesday, May 28
Neo Crypto Price News Today
Unlocking ASX Trading Success: Car Group Limited - Tuesday, May 27
At TradingLounge™, we provide actionable Elliott Wave analysis across over 200 markets. Access live chat rooms, advanced AI & algorithmic charting tools, and curated trade ...
more

