
Indian Stocks Larsen & Toubro
LARSEN & TOUBRO Elliott Wave Analysis – Trading Lounge Day Chart
LARSEN & TOUBRO Elliott Wave Technical Analysis
FUNCTION: Bullish Trend
MODE: Impulsive
STRUCTURE: Navy Blue Wave 1
POSITION: Gray Wave 1
DIRECTION NEXT LOWER DEGREES: Navy Blue Wave 2
DETAILS: Orange Wave 4 appears complete. Navy Blue Wave 1 of Gray Wave 1 is active now.
Wave Cancel Invalid Level: 2969
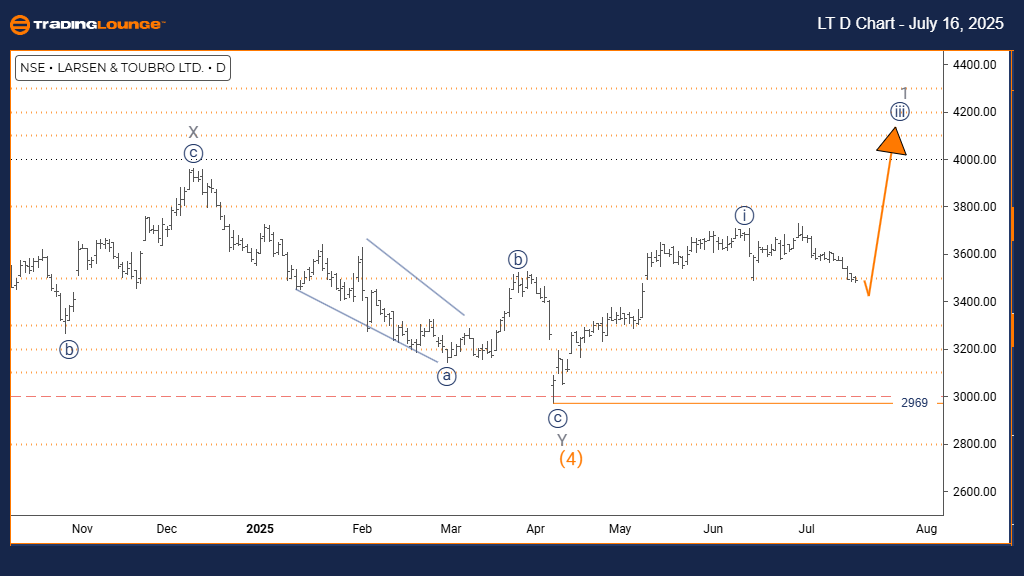
The Elliott Wave analysis of LARSEN & TOUBRO's daily chart shows a bullish market trend with a clear impulsive structure. The price is forming a Navy Blue Wave 1 within a broader Gray Wave 1, signaling an early phase of an upward move. Observations show that Orange Wave 4 has likely ended, and the price is now moving within Navy Blue Wave 1 of Gray Wave 1.
The impulsive wave formation supports strong bullish momentum, shown by consistent higher highs and higher lows. The next expected move is Navy Blue Wave 2, which is usually a corrective phase after an impulse. The key invalidation level is 2969 — a break below this level would negate the current bullish setup and require re-evaluation.
This technical scenario suggests LARSEN & TOUBRO has exited its correction and entered a new impulsive phase with potential upside. Being within Gray Wave 1, this could mark the beginning of a larger bullish cycle. Traders should watch Navy Blue Wave 1 for completion signs before preparing for Wave 2's retracement.
The 2969 level is crucial to keep the bullish view valid. Staying above this mark supports the wave structure. This analysis helps traders identify potential buying opportunities during corrections and manage risk using the defined invalidation level. The current impulsive nature points to sustained bullish momentum, which may continue after any short-term pullbacks.
LARSEN & TOUBRO Elliott Wave Analysis – Trading Lounge Weekly Chart
LARSEN & TOUBRO Elliott Wave Technical Analysis
FUNCTION: Bullish Trend
MODE: Impulsive
STRUCTURE: Gray Wave 1
POSITION: Orange Wave 5
DIRECTION NEXT LOWER DEGREES: Gray Wave 2
DETAILS: Orange Wave 4 appears completed. Gray Wave 1 is now forming.
Wave Cancel Invalid Level: 2969
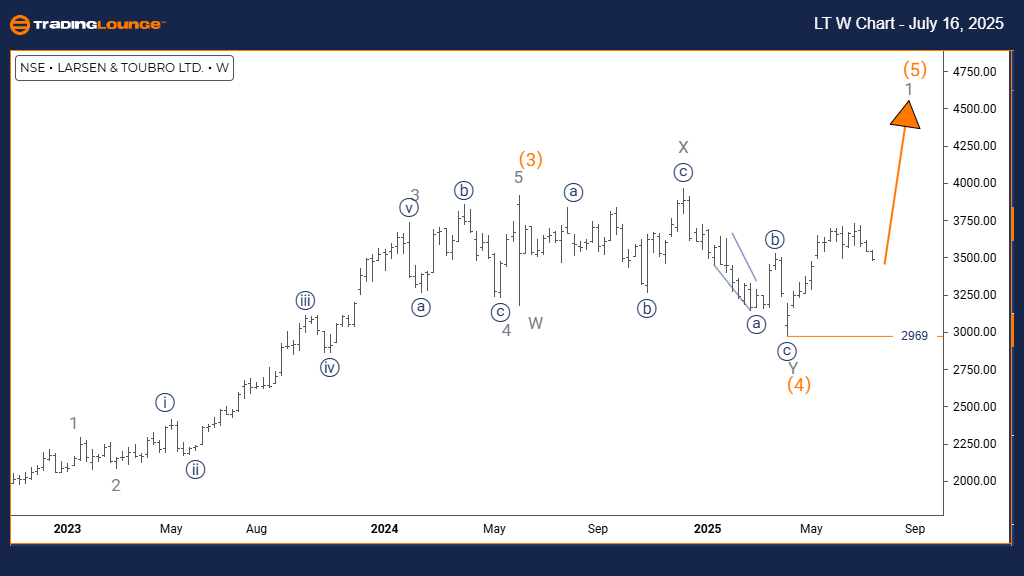
The weekly Elliott Wave analysis of LARSEN & TOUBRO reflects a strong bullish trend with a clear impulsive pattern. Gray Wave 1 is currently developing, situated within the broader Orange Wave 5, showing the stock is in an advanced stage of its upward cycle. Technical insights confirm Orange Wave 4 has ended, and the price is progressing into Gray Wave 1, the start of a fresh upward wave within the ongoing bullish structure.
This impulsive phase is supported by strong upward momentum, likely driven by institutional demand. Since the wave appears during Orange Wave 5, it might be part of the final leg of this intermediate trend, while Gray Wave 1 signals the start of a new broader move. The invalidation level of 2969 acts as a critical support — any break below this would challenge the bullish outlook.
This chart setup indicates that LARSEN & TOUBRO has ended its correction and is starting a new impulse wave that could bring further gains. The expected next move at a smaller degree is Gray Wave 2, usually a short-term correction after the impulse. The weekly analysis confirms a robust bullish pattern and supports a long-term view aligned with trend continuation.
The 2969 level serves as a crucial support line for risk control. Staying above this supports the current wave count. This analysis gives a broader understanding of where the stock sits in its long-term trend, indicating strong momentum and a likely continuation. Traders can align strategies with the trend while using this invalidation level to manage risk. Watching for signs of completion in Gray Wave 1 will be key before expecting the next pullback. The weekly chart provides clear confirmation of the broader bullish context.
Technical Analyst: Malik Awais
More By This Author:
Unlocking ASX Trading Success: Unibail-Rodamco-Westfield - Tuesday, July 15
U.S. Stocks: Apple Inc.
Elliott Wave Technical Analysis: British Pound/Australian Dollar - Tuesday, July 15
At TradingLounge™, we provide actionable Elliott Wave analysis across over 200 markets. Access live chat rooms, advanced AI & algorithmic charting tools, and curated trade ...
more

