
GRASIM INDUSTRIES Elliott Wave Analysis Trading Lounge Day Chart
GRASIM INDUSTRIES Elliott Wave Technical Analysis
FUNCTION: Bullish Trend
MODE: Impulsive
STRUCTURE: Navy Blue Wave 3
POSITION: Gray Wave 1
DIRECTION NEXT HIGHER DEGREES: Navy Blue Wave 3 (Started)
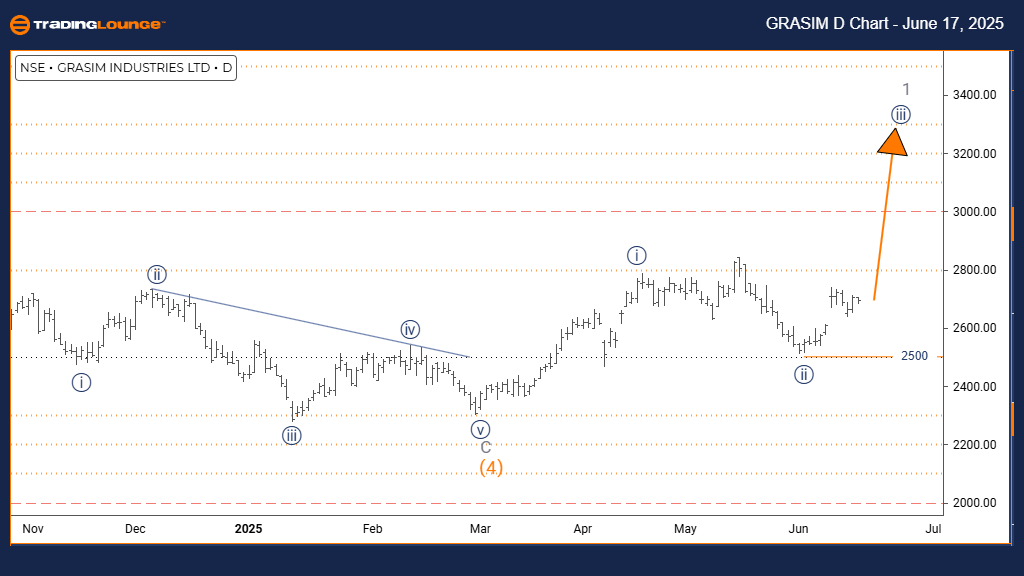
DETAILS: Navy blue wave 2 appears complete; now navy blue wave 3 of 1 is unfolding.
Cancel Invalid Level: 2500
The daily Elliott Wave chart analysis for GRASIM INDUSTRIES shows a bullish pattern. The price action is in an impulsive phase, which signals strong upward momentum. The current wave structure highlights navy blue wave 3, part of a broader sequence under gray wave 1. This structure places the stock in a significant advancing phase of a larger uptrend.
The chart indicates navy blue wave 2 has likely finished its corrective move, and the market has now entered navy blue wave 3 of gray wave 1. This phase typically shows the strongest price surge in an Elliott Wave cycle. The next degree of interest is navy blue wave 3, which has just started based on current wave analysis.
An important level to monitor is the invalidation point at 2500. If the price drops below this, the current wave setup will be invalid, and the bullish outlook must be reviewed. Until that happens, the chart supports a continuation of the upward move.
The technical analysis signals that GRASIM INDUSTRIES is well-positioned for a potential extended rally. The active navy blue wave 3 following the completion of wave 2 shows strong market interest, suggesting the possibility of further gains ahead.
GRASIM INDUSTRIES Elliott Wave Analysis Trading Lounge Weekly Chart
GRASIM INDUSTRIES Elliott Wave Technical Analysis
FUNCTION: Bullish Trend
MODE: Impulsive
STRUCTURE: Navy Blue Wave 3
POSITION: Gray Wave 1
DIRECTION NEXT HIGHER DEGREES: Navy Blue Wave 3 (Started)
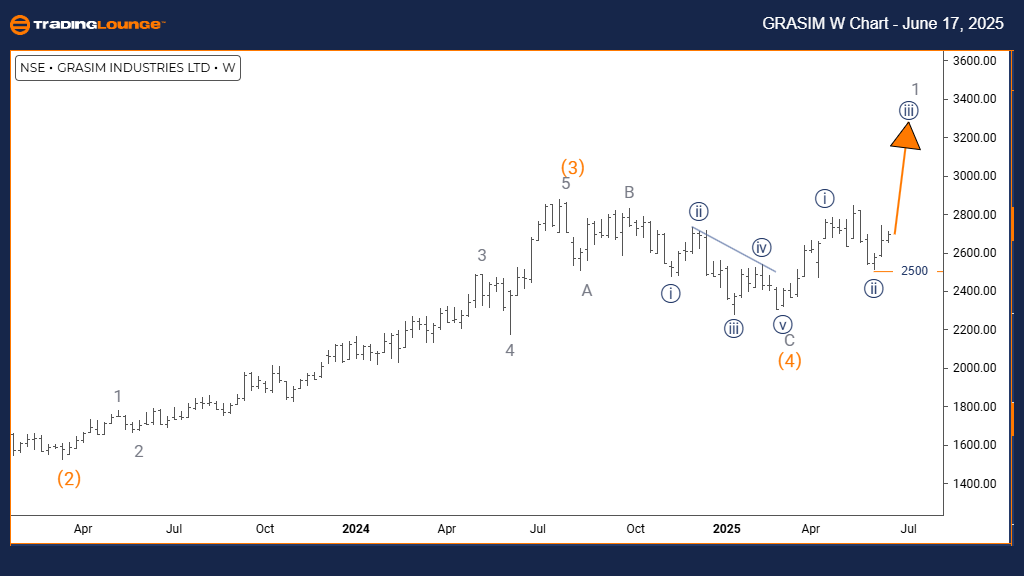
DETAILS: Navy blue wave 2 appears complete; navy blue wave 3 of 1 is now developing.
Cancel Invalid Level: 2500
The weekly Elliott Wave chart for GRASIM INDUSTRIES confirms a bullish trend. The current market behavior is impulsive, suggesting strong upward pressure. The identified structure is navy blue wave 3 within a broader wave formation under gray wave 1. This indicates the stock is moving through the most powerful stage of its upward cycle, where third waves often bring the sharpest gains.
According to the wave analysis, navy blue wave 2 has ended its correction phase. The market is now transitioning into navy blue wave 3 of gray wave 1. This wave is generally the most profitable section in an Elliott Wave setup, marked by extended price increases and limited pullbacks. Investors should continue monitoring navy blue wave 3 as it evolves internally.
The invalidation level remains fixed at 2500. If the price drops below this support, the bullish count becomes void and would need revision. However, unless this occurs, the current structure continues to indicate a strong uptrend.
The technical view suggests that GRASIM INDUSTRIES is poised for notable medium-term gains. With navy blue wave 3 now underway and wave 2 complete, the impulsive setup points to sustained buying interest and strong upward price movement.
Technical Analyst: Malik Awais
More By This Author:
Elliott Wave Technical Analysis: Ethereum Crypto Price News For Tuesday, June 17
Elliott Wave Technical Analysis: Natural Gas - Monday, June 16
Elliott Wave Technical Analysis: New Zealand Dollar/U.S. Dollar - Monday, June 16


Comments
Log in or sign up to join the conversation.