

Image Source: Pixabay
Ethereum (ETHUSD) Elliott Wave Analysis – Daily & H4 Chart
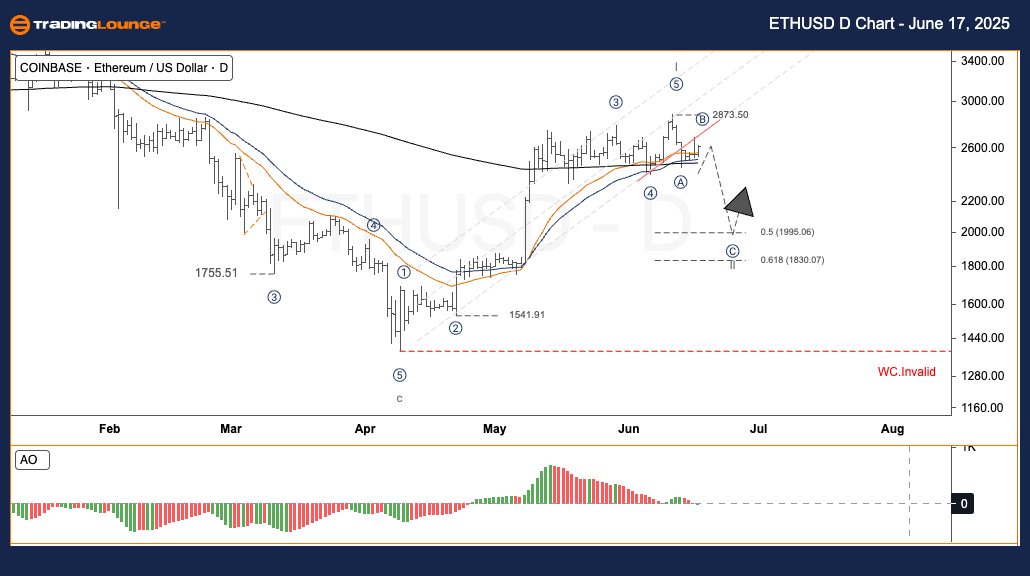
Daily Chart – ETHUSD Technical Analysis by TradingLounge
- Function: Follow Trend
- Mode: Motive
- Structure: Impulse
- Current Wave Position: Wave 2
- Wave Cancel Invalid Level: Pending
Technical Overview:
Ethereum (ETH) surged above the $2,800 mark during Wave I, showing a solid bullish impulse. Following this, price action weakened, indicating a consolidation that fits into a Wave II bearish correction scenario. As per Elliott Wave principles, if prices remain above key Fibonacci support and bullish momentum returns, a powerful Wave III may follow—potentially the strongest in this cycle.
ETHUSD Trading Strategy
- Short-Term Strategy (Swing Trade):
-
- Entry Zone: Wave II may offer accumulation opportunities. Look for bullish reversals from the $2,100 to $1,950 zone.
- Risk Management:
-
- Invalidation Level: $1,385.76 – Breaching this level would nullify the current wave count and necessitate a reassessment.
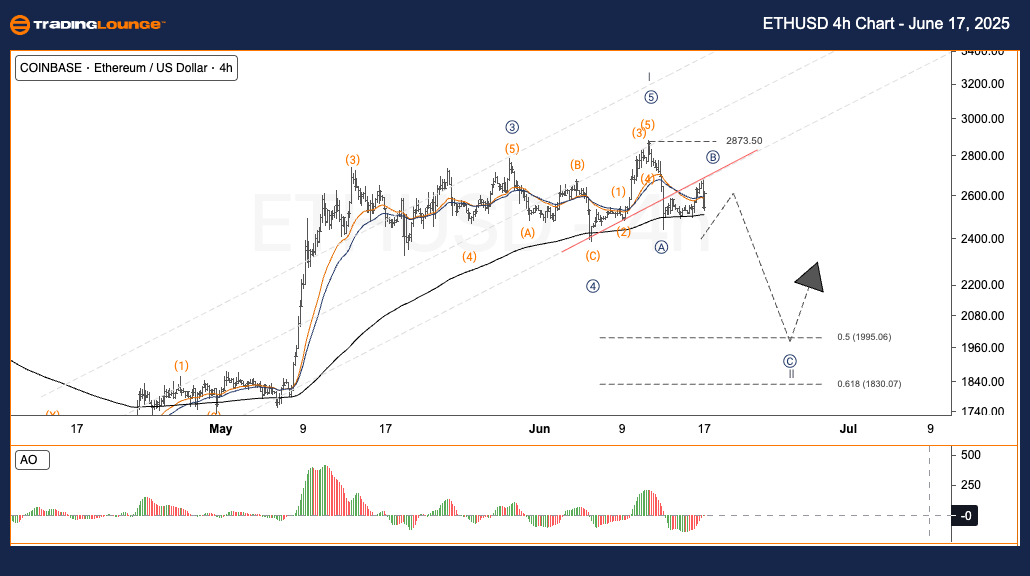
H4 Chart – ETHUSD Technical Analysis by TradingLounge
- Function: Follow Trend
- Mode: Motive
- Structure: Impulse
- Current Wave Position: Wave 2
- Wave Cancel Invalid Level: Pending
Market Summary:
Similar to the Daily Chart, Ethereum’s H4 structure reaffirms the transition into a Wave II correction. A potential bullish Wave III could emerge if the price structure holds above the $1,950–$2,100 region. Traders should watch this zone for confirmation signals.
Analyst: Kittiampon Somboonsod, CEWA
Source: TradingLounge.com
More By This Author:
Elliott Wave Technical Analysis: Natural Gas - Monday, June 16
Elliott Wave Technical Analysis: New Zealand Dollar/U.S. Dollar - Monday, June 16
VeChain Crypto Price News Today - Monday, June 16


Comments
Log in or sign up to join the conversation.