
NZDUSD Elliott Wave Analysis | Trading Lounge
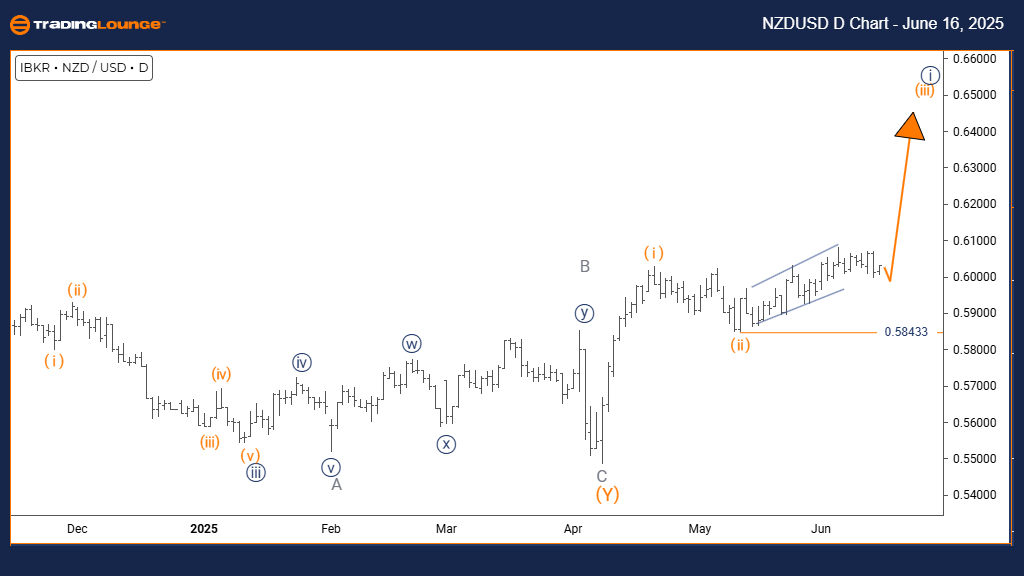
New Zealand Dollar / U.S. Dollar (NZDUSD) Day Chart
NZDUSD Elliott Wave Technical Analysis
FUNCTION: Bullish Trend
MODE: Impulsive
STRUCTURE: Orange Wave 3
POSITION: Navy Blue Wave 1
DIRECTION NEXT HIGHER DEGREES: Orange Wave 3 (in progress)
DETAILS: Orange Wave 2 appears complete; Orange Wave 3 is now active.
Wave Cancel Invalidation Level: 0.58433
The daily chart analysis for NZDUSD indicates a bullish trend, with current price action moving impulsively. The structure is recognized as Orange Wave 3 within Navy Blue Wave 1, suggesting a strong upward phase in a broader bullish trend.
With Orange Wave 2 seemingly finished, Orange Wave 3 is now active. This wave typically generates the most dynamic and extended price movements in an Elliott Wave sequence. The analysis identifies that Orange Wave 3 has just started, signifying potential for further upward gains.
The invalidation level is at 0.58433. A break below this point would nullify the current wave outlook and require a revised analysis. As long as the price stays above this level, the bullish structure remains valid.
Current chart conditions support a sustained rise, with Orange Wave 3 gaining momentum after the completion of Orange Wave 2. The impulsive character of this move suggests continued buying strength and prospects for significant price increases.
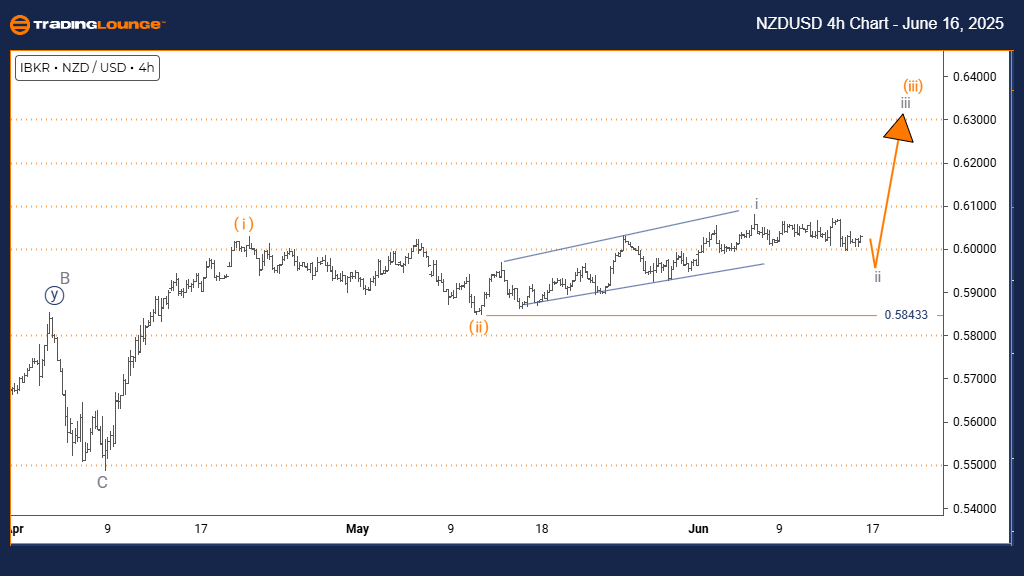
NZDUSD Elliott Wave Analysis | Trading Lounge 4-Hour Chart
New Zealand Dollar / U.S. Dollar (NZDUSD) 4-Hour Chart
NZDUSD Elliott Wave Technical Analysis
FUNCTION: Counter Trend
MODE: Corrective
STRUCTURE: Gray Wave 2
POSITION: Orange Wave 3
DIRECTION NEXT HIGHER DEGREES: Gray Wave 3
DETAILS: Gray Wave 1 appears complete; Gray Wave 2 is currently forming.
Wave Cancel Invalidation Level: 0.58433
The 4-hour chart analysis of NZDUSD highlights a counter-trend corrective phase. Price action is undergoing a retracement, which is typical within a broader upward move. The current structure is identified as Gray Wave 2, positioned within Orange Wave 3.
With Gray Wave 1 likely completed, the chart now reflects a transition into Gray Wave 2. This is a normal retracement phase, potentially leading into Gray Wave 3, which would resume the dominant trend.
The price level of 0.58433 remains the invalidation point. Any movement below this value would invalidate the current Elliott Wave outlook. For now, the technical structure supports a pullback within a bullish setup.
Traders should closely watch the progression of Gray Wave 2, as its completion would likely signal the beginning of Gray Wave 3. While the current phase is corrective, it is expected to give way to renewed upward momentum in line with the broader trend.
Technical Analyst: Malik Awais
More By This Author:
Elliott Wave Technical Analysis: Natural Gas - Monday, June 16
VeChain Crypto Price News Today - Monday, June 16
Unlocking ASX Trading Success: BHP Group Ltd.


Comments
Log in or sign up to join the conversation.