
Indian Stocks - Grasim Industries
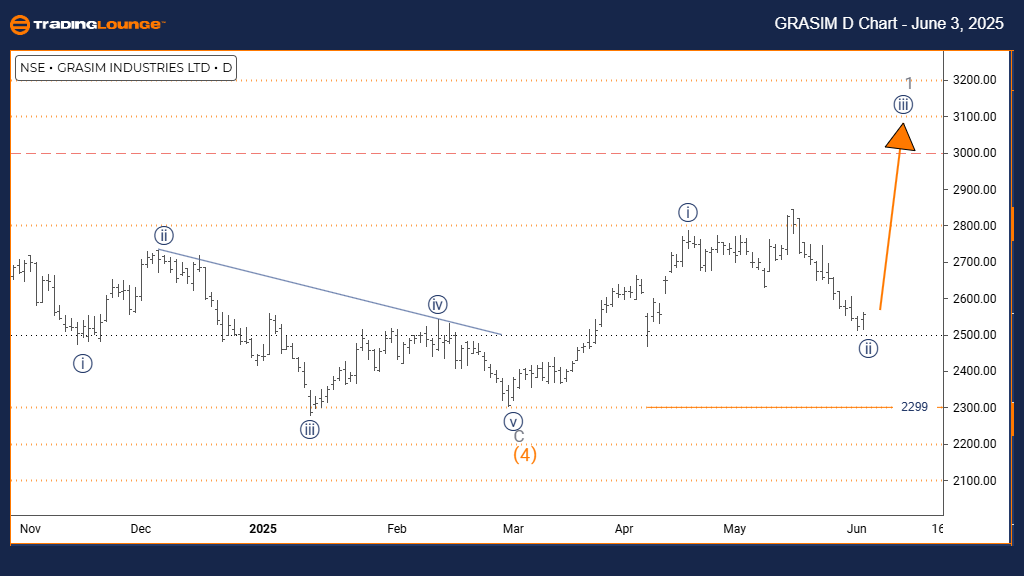
GRASIM INDUSTRIES Elliott Wave Analysis Trading Lounge Day Chart
GRASIM INDUSTRIES Elliott Wave Technical Analysis
FUNCTION: Trend
MODE: Impulsive
STRUCTURE: Navy blue wave 3
POSITION: Gray wave 1
DIRECTION NEXT HIGHER DEGREES: Navy blue wave 3 (active)
DETAILS: Navy blue wave 2 appears completed; navy blue wave 3 of 1 is now in play.
Cancel invalid level: 2299
The daily chart analysis shows Grasim Industries gaining strong bullish momentum within an established uptrend. The current setup highlights navy blue wave three forming inside the broader bullish framework of gray wave one. This indicates navy blue wave two has ended and the stock is now moving into what is generally the most dynamic portion of an Elliott Wave impulse.
Navy blue wave two’s completion signals the onset of navy blue wave three, marked by increased buying pressure. Positioned within gray wave one, this phase carries significant upside potential. A key support level at 2299 acts as a validation point—falling below this would invalidate the current wave structure and may signal a trend reassessment.
This analysis equips investors with essential insights into the stock’s placement within its broader bullish trend. Grasim Industries may now experience an accelerated rally phase, offering meaningful upside before the next corrective move begins. The next probable development is the continuation of navy blue wave three within gray wave one’s structure.
Traders should monitor price activity to confirm the momentum of wave three and stay vigilant for any drop below the 2299 level. As long as support holds, the bullish outlook remains favorable during this high-momentum stage.
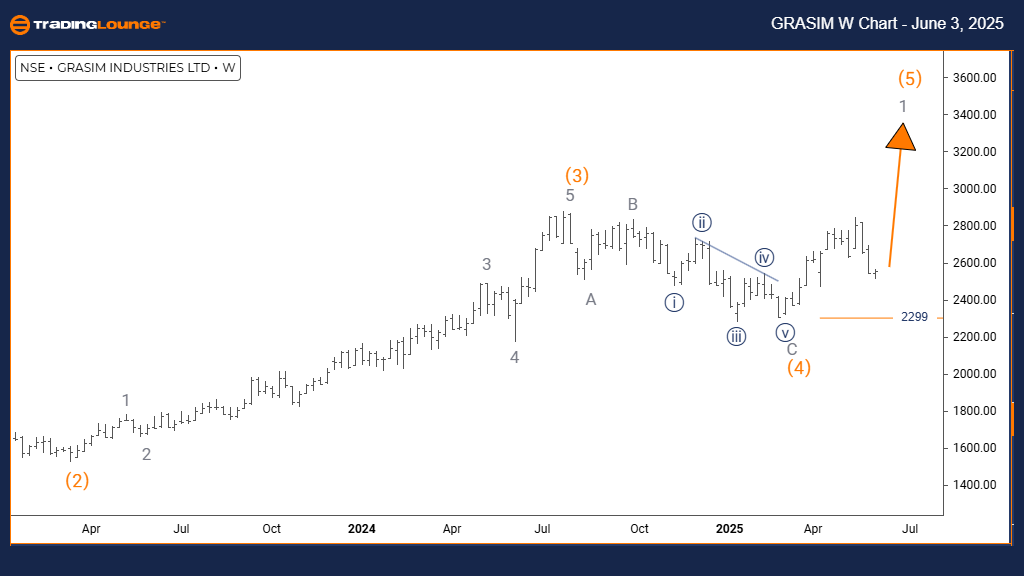
GRASIM INDUSTRIES Elliott Wave Analysis Trading Lounge Weekly Chart
GRASIM INDUSTRIES Elliott Wave Technical Analysis
FUNCTION: Trend
MODE: Impulsive
STRUCTURE: Gray wave 1
POSITION: Orange wave 5
DIRECTION NEXT LOWER DEGREES: Gray wave 2
DETAILS: Orange wave 4 appears completed; gray wave 1 of 5 is now underway.
Cancel invalid level: 2299
The weekly chart reflects Grasim Industries nearing the final phase of its bullish trend. The analysis points to gray wave one forming within a broader sequence labeled as orange wave five. This indicates the end of orange wave four and the start of the final impulsive wave in the current uptrend.
With orange wave four completed, the movement into gray wave one suggests continued upward pressure. However, since this is likely the last wave of the cycle, traders should stay cautious for signs of momentum weakening. The 2299 level remains critical—any break below this may call the wave count into question and indicate a larger corrective pattern ahead.
This technical overview helps long-term investors understand Grasim’s position in its market cycle. There may be a final leg upward to complete the five-wave sequence before a significant retracement begins. This stage calls for prudent trade management and monitoring of potential reversal signs.
Participants should watch closely for indicators such as divergence or slowing momentum, which often accompany a fifth wave's maturation. While the current setup remains bullish, the chart stresses the need for vigilance as the cycle approaches completion.
Technical Analyst: Malik Awais
More By This Author:
Elliott Wave Technical Analysis Shanghai Composite Index
Elliott Wave Technical Analysis: Polkadot Crypto Price News For Tuesday, June 3
Unlocking ASX Trading Success: Insurance Australia Group Limited - Monday, June 2
At TradingLounge™, we provide actionable Elliott Wave analysis across over 200 markets. Access live chat rooms, advanced AI & algorithmic charting tools, and curated trade ...
more

