
Dr. Reddy's Laboratories Elliott Wave Analysis | Trading Lounge Day Chart
Dr. Reddy's Laboratories Elliott Wave Technical Analysis
- FUNCTION: Counter Trend
- MODE: Corrective
- STRUCTURE: Orange Wave 4
- POSITION: Navy Blue Wave 1
- DIRECTION NEXT LOWER DEGREES: Orange Wave 5
- DETAILS: Orange Wave 3 appears to have ended. Orange Wave 4 is now forming.
- Wave Cancel Invalid Level: 1018
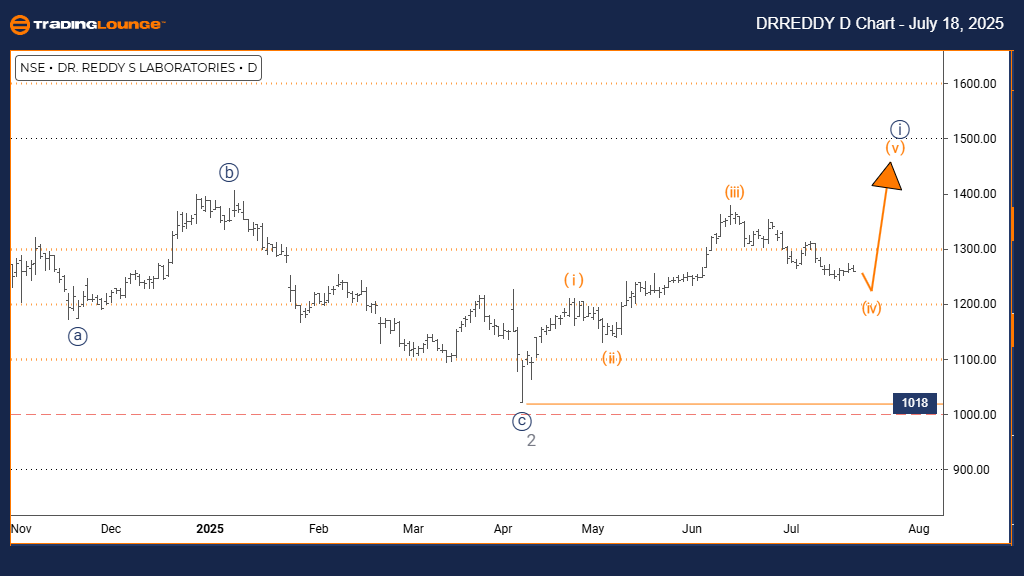
The daily Elliott Wave chart for Dr. Reddy's Laboratories shows that the stock is currently moving through a counter-trend corrective phase within a broader upward structure. At this stage, Orange Wave 4 is developing inside Navy Blue Wave 1, signaling a temporary pullback after completing Orange Wave 3. This is a normal part of wave formation before the final wave in the pattern, Orange Wave 5, takes shape.
The market behavior during this phase reflects features of a correction—lower momentum and either a basic pullback or a sideways movement. The critical invalidation level is set at 1018. If the price crosses this level, the current wave analysis would be considered invalid. This price point is crucial for confirming the validity of the ongoing correction.
Once Orange Wave 4 finishes, the next expected movement is Orange Wave 5, completing this leg of the sequence. Since this occurs within Navy Blue Wave 1, it forms part of a bigger trend, with the correction representing a temporary slowdown rather than a full reversal. The daily chart helps put this retracement in context of the overall price movement.
This Elliott Wave analysis provides traders with a clear structure to evaluate the stock’s current phase in the market cycle. The correction phase offers fewer trade setups until it shows signs of nearing its end. After that, Orange Wave 5 is expected to follow, bringing back stronger price movement. The current setup confirms that the stock remains within a larger trend, and this correction is part of its natural wave structure—not a sign of a trend break.
Dr. Reddy's Laboratories Elliott Wave Analysis | Trading Lounge Weekly Chart
Dr. Reddy's Laboratories Elliott Wave Technical Analysis
- FUNCTION: Bullish Trend
- MODE: Impulsive
- STRUCTURE: Navy Blue Wave 1
- POSITION: Gray Wave 3
- DIRECTION NEXT LOWER DEGREES: Navy Blue Wave 2
- DETAILS: Gray Wave 2 appears complete, and Navy Blue Wave 1 of 3 is now underway.
- Wave Cancel Invalid Level: 1018
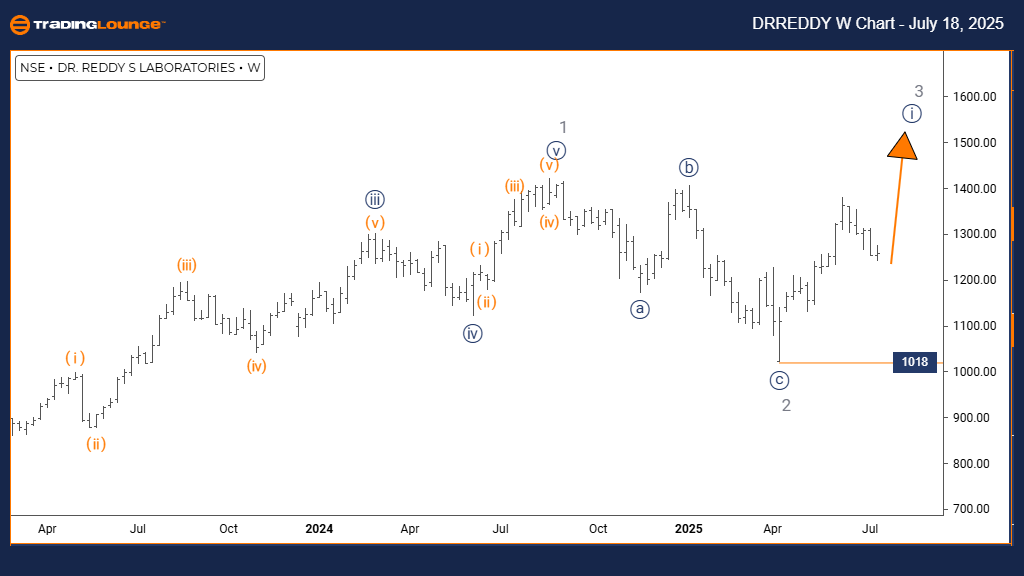
The weekly Elliott Wave analysis for Dr. Reddy's Laboratories shows that the stock is in a bullish trend, with a clear impulsive structure in the price movement. The current market structure reflects Navy Blue Wave 1 forming within Gray Wave 3, pointing to a strong upward phase. Gray Wave 2 appears to have ended, and now Navy Blue Wave 1 of Gray Wave 3 is active, indicating the early stages of a potential extended rally.
The impulsive movement features rising momentum with a pattern of higher highs, which typically signals strength in the trend. The position within Gray Wave 3 suggests this could lead to a broader advance, with Navy Blue Wave 1 setting the tone before the next wave segments unfold. The invalidation level remains at 1018, marking a key technical point that would nullify the current bullish wave count if broken.
The analysis shows that Dr. Reddy's Laboratories has likely shifted from a correction to a new impulsive wave, potentially offering significant upside. This weekly timeframe highlights the overall strength of the current trend and indicates the stock is at the beginning of a broader bullish move within Gray Wave 3.
Traders can apply this Elliott Wave structure to assess potential entry points on price pullbacks while considering the overall bullish outlook. The initial stages of this upward leg may offer opportunity, supported by strong market demand. The 1018 level remains a critical checkpoint to ensure the bullish view remains valid. Watching how Navy Blue Wave 1 develops will help traders anticipate when Navy Blue Wave 2 may start. This weekly analysis provides valuable insight into the broader trend potential.
Technical Analyst: Malik Awais
More By This Author:
Unlocking ASX Trading Success: Amcor
U.S. Stocks - Micron Technology Inc
Elliott Wave Technical Analysis: British Pound/U.S. Dollar - Thursday, July 17


Comments
Log in or sign up to join the conversation.