Indian Stocks: Coal India Ltd.
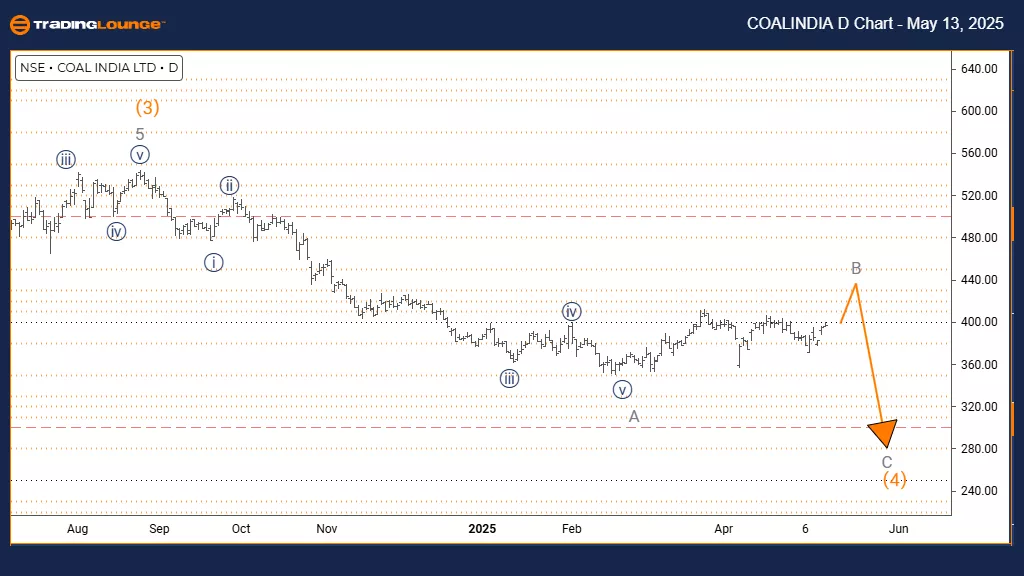
COAL INDIA Elliott Wave Analysis Trading Lounge Day Chart
COAL INDIA Elliott Wave Technical Analysis
FUNCTION: Counter Trend
MODE: Corrective
STRUCTURE: Gray Wave B
POSITION: Orange Wave 4
DIRECTION NEXT LOWER DEGREES: Gray Wave C
DETAILS: Gray wave A appears completed; gray wave B of 4 is now active.
The daily chart for Coal India shows a counter-trend setup with corrective behavior. The analysis identifies gray wave B unfolding within the broader orange wave 4 structure. This suggests that gray wave A has been completed and the stock has now entered a temporary upward correction.
This retracement, characterized as gray wave B, indicates a corrective bounce that may precede a renewed decline in gray wave C. The structure confirms that gray wave A is finished, and gray wave B is in progress. The expected next move will be gray wave C, likely continuing the overall downward path after the current correction concludes. Given its corrective nature, wave B implies limited upside unless significant resistance levels are broken.
This setup gives traders essential insight into Coal India's place within a broader correction cycle. It suggests that volatility may persist while gray wave B plays out. Investors should watch closely for signs of its completion, as this could mark the beginning of the downward wave C. This technical framework outlines the current counter-trend opportunity while preparing for a possible bearish continuation.

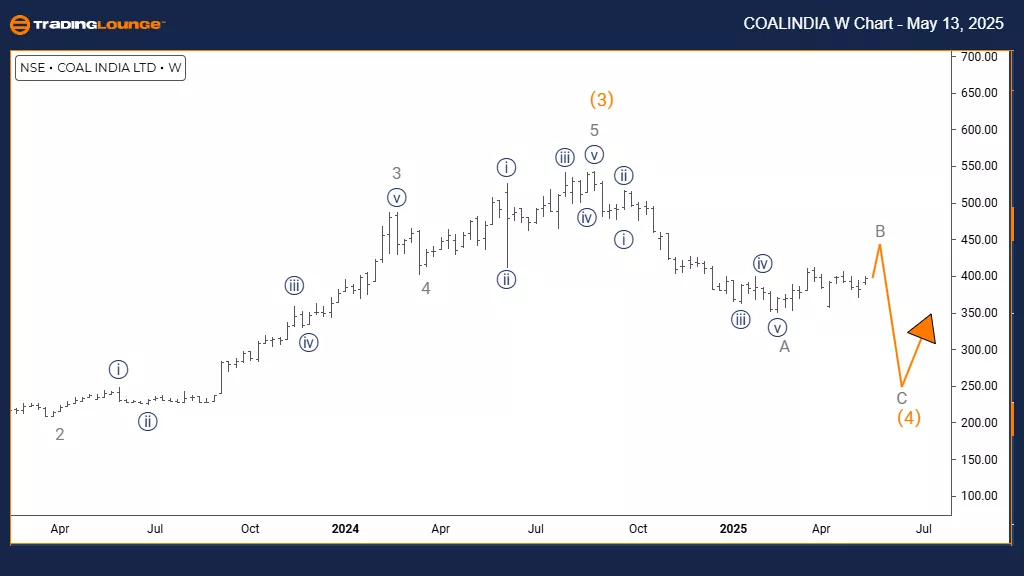
COAL INDIA Elliott Wave Analysis Trading Lounge Weekly Chart
COAL INDIA Elliott Wave Technical Analysis
FUNCTION: Counter Trend
MODE: Corrective
STRUCTURE: Orange Wave 4
POSITION: Navy Blue Wave 1
DIRECTION NEXT HIGHER DEGREES: Orange Wave 5
DETAILS: Orange wave 3 appears completed; orange wave 4 is now in play.
The weekly chart analysis for Coal India highlights a counter-trend corrective phase within a broader bullish framework. Currently, orange wave 4 is progressing as part of a five-wave sequence, following the completion of orange wave 3. Positioned within navy blue wave 1, this suggests the current movement is a short-term pullback rather than a trend reversal.
Wave four corrections typically feature sideways or slight downward price action before the bullish momentum resumes with orange wave 5. The analysis confirms the end of orange wave 3, transitioning into a temporary retracement. Traders should watch for this correction to stay within expected Fibonacci ranges before the next upward move begins.
This long-term view emphasizes that the present pullback could be a potential buying zone in preparation for wave five. The corrective characteristics indicate limited downside, supporting the case for an eventual trend continuation. Investors should track the development for signs of wave four's conclusion and position accordingly within the prevailing bullish trend.

Technical Analyst: Malik Awais
More By This Author:
Elliott Wave Technical Analysis: Nikkei 225 Index - Tuesday, May 13
Elliott Wave Technical Analysis: Ethereum Crypto Price News For Tuesday, May 13
Unlocking ASX Trading Success: Car Group Limited - Monday, May 12
At TradingLounge™, we provide actionable Elliott Wave analysis across over 200 markets. Access live chat rooms, advanced AI & algorithmic charting tools, and curated trade ...
more


