

Image Source: Pixabay
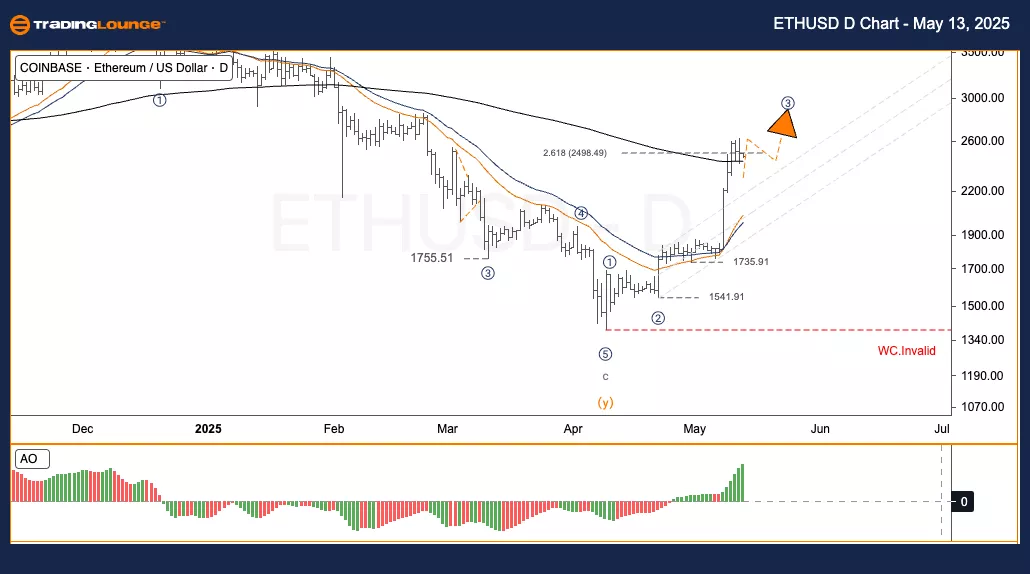
Elliott Wave Analysis | TradingLounge Daily Chart | Ethereum/U.S. Dollar (ETHUSD)
ETHUSD Elliott Wave Technical Analysis
Function: Follow Trend
Mode: Motive
Structure: Impulse
Position: Wave 3
Direction Next Higher Degrees:
Wave Cancel Invalid Level:
Ethereum/U.S. Dollar (ETHUSD) Trading Strategy:
ETHUSD advancing in Wave (3); consolidation expected before Wave (5) with targets above $3000
Ethereum surged past the $2600 mark after completing Wave (2) at $1541 with an ABC corrective formation. The cryptocurrency has entered a strong Wave (3) impulsive rally. Currently, ETHUSD appears to be nearing the end of Wave (3) and is showing signs of entering a consolidation phase before initiating the final upward leg, Wave (5).
Trading Strategies
Strategy:
✅ Short-term Traders (Swing Trading):
Monitor price action as it approaches the $2,290–$2,300 range. Look for reversal signals like a bullish engulfing candlestick or a long wick near support. This signals a potential entry for long accumulation.
Risk Management:
🟥 Place a stop-loss below $2,250 and set profit targets above $3,000, aligning with the anticipated Wave (5).
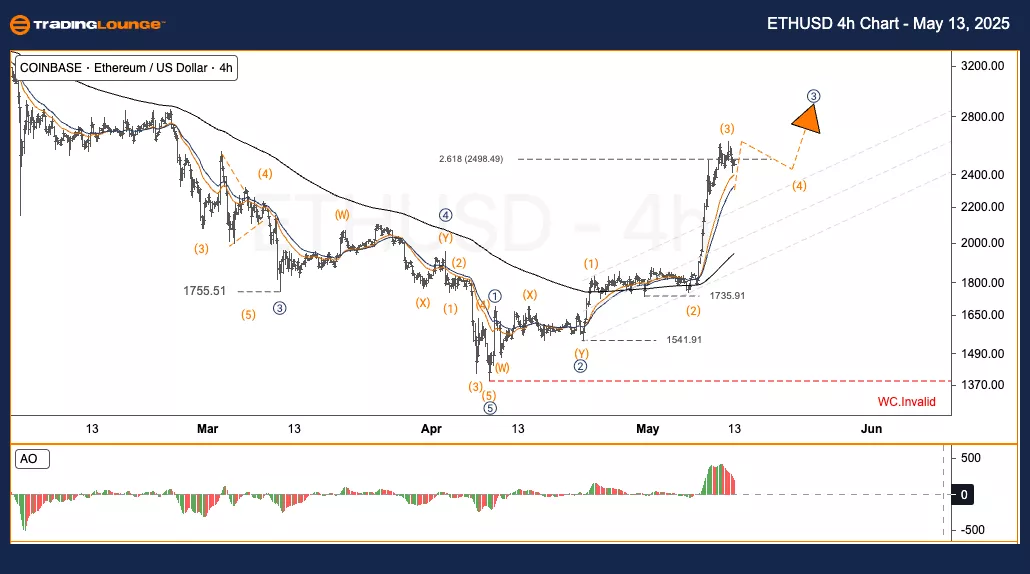
Elliott Wave Analysis | TradingLounge H4 Chart | Ethereum/U.S. Dollar (ETHUSD)
ETHUSD Elliott Wave Technical Analysis
Function: Follow Trend
Mode: Motive
Structure: Impulse
Position: Wave 3
Direction Next Higher Degrees:
Wave Cancel Invalid Level:
Ethereum/U.S. Dollar (ETHUSD) Trading Strategy:
ETHUSD advancing in Wave (3); consolidation expected before Wave (5) with targets above $3000
Ethereum surged past the $2600 mark after completing Wave (2) at $1541 with an ABC corrective formation. The cryptocurrency has entered a strong Wave (3) impulsive rally. Currently, ETHUSD appears to be nearing the end of Wave (3) and is showing signs of entering a consolidation phase before initiating the final upward leg, Wave (5).
Trading Strategies
Strategy:
✅ Short-term Traders (Swing Trading):
Monitor price action as it approaches the $2,290–$2,300 range. Look for reversal signals like a bullish engulfing candlestick or a long wick near support. This signals a potential entry for long accumulation.
Risk Management:
🟥 Place a stop-loss below $2,250 and set profit targets above $3,000, aligning with the anticipated Wave (5).
TradingLounge Analyst: Kittiampon Somboonsod, CEWA
More By This Author:
Unlocking ASX Trading Success: Car Group Limited - Monday, May 12
Elliott Wave Technical Analysis: Mastercard Inc. - Monday, May 12
Elliott Wave Technical Analysis: Australian Dollar/U.S. Dollar - Monday, May 12


Comments
Log in or sign up to join the conversation.