
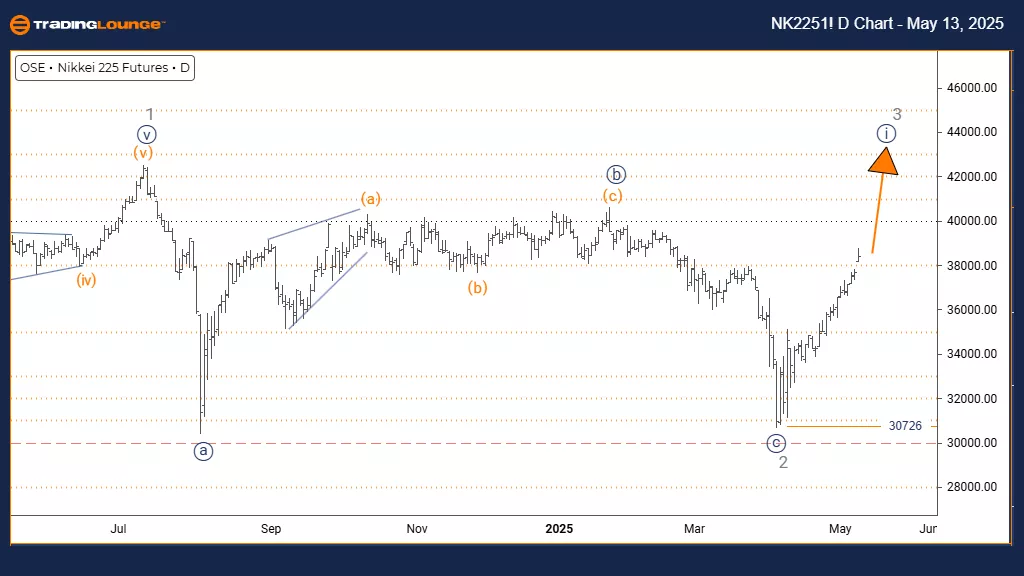
NIKKEI 225 (N225)
Elliott Wave Analysis Trading Lounge Day Chart
NIKKEI 225 (N225) Wave Technical Analysis
FUNCTION: Bullish Trend
MODE: Impulsive
STRUCTURE: Navy Blue Wave 1
POSITION: Gray Wave 3
DIRECTION NEXT LOWER DEGREES: Navy Blue Wave 2
DETAILS: Gray wave 2 appears completed; navy blue wave 1 of 3 is now in progress.
Wave Cancel Invalid Level: 30726
The Nikkei 225 daily chart shows a strong bullish trend with impulsive wave characteristics. Navy blue wave 1 is now forming within the broader gray wave 3, signaling that the market has ended gray wave 2 and entered a new upward phase. This pattern indicates the beginning of a potential major rally, with navy blue wave 1 being the initial thrust in the larger bullish move.
Analysis confirms the completion of gray wave 2, ushering in the start of a new upward leg. Following navy blue wave 1, the next likely move in lower degrees will be navy blue wave 2, which typically acts as a corrective pullback. The invalidation level at 30726 is crucial—if breached, it may point to a more complex pattern or potential trend reversal. The ongoing impulsive action suggests strong buyer participation is driving prices upward, reinforcing the bullish scenario.
Traders are advised to watch for signals indicating the end of navy blue wave 1 to prepare for a likely wave 2 correction. Until then, the structure supports further gains. The invalidation level at 30726 provides a vital support reference for bullish strategies, helping participants time entries and manage risk.
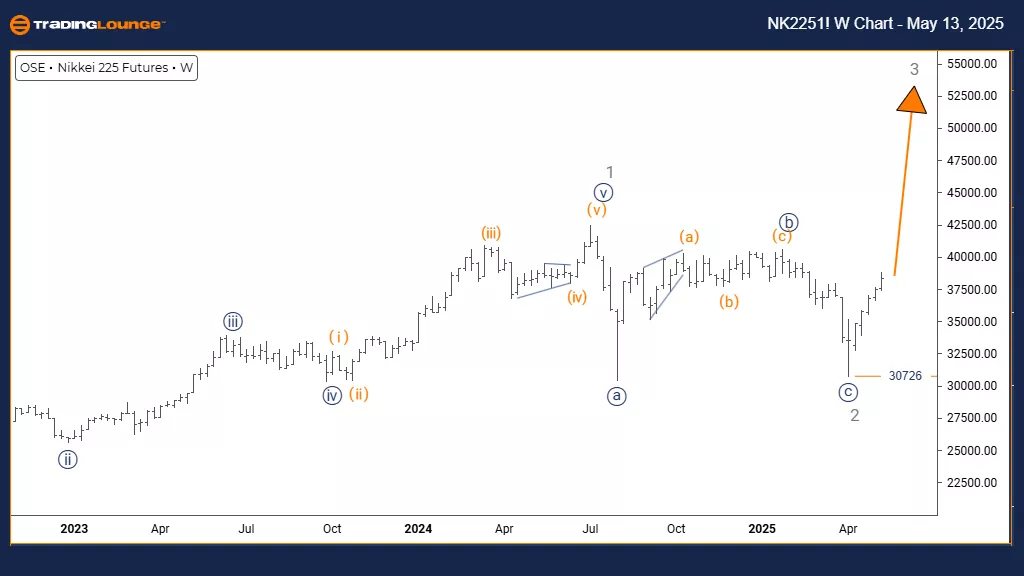
NIKKEI 225 (N225)
Elliott Wave Analysis Trading Lounge Weekly Chart
NIKKEI 225 (N225) Wave Technical Analysis
FUNCTION: Bullish Trend
MODE: Impulsive
STRUCTURE: Gray Wave 3
POSITION: Orange Wave 3
DIRECTION NEXT HIGHER DEGREES: Gray Wave 3 (Started)
DETAILS: Gray wave 2 appears completed; gray wave 3 of 3 is now active.
Wave Cancel Invalid Level: 30726
The weekly chart analysis of the Nikkei 225 shows a strong bullish trend, highlighted by clear impulsive behavior in the current wave structure. The index is advancing within gray wave 3, which itself belongs to orange wave 3—indicating a potent rally phase. The completion of gray wave 2 confirms the transition into gray wave 3, typically the most aggressive and extended wave in an Elliott Wave sequence.
This bullish trend is expected to continue as gray wave 3 develops further within the larger orange wave 3. The key invalidation level stands at 30726. A break below this level would invalidate the current wave structure, possibly suggesting a different pattern. The impulsive mode supports continued buying pressure, likely driven by institutional interest, with the weekly timeframe suggesting more gains ahead.
Traders should track the wave progression for signs of continuation or early reversal. The 30726 level is essential for risk management and maintaining a bullish perspective. This analysis frames the Nikkei 225’s position in a long-term bullish cycle, emphasizing both the opportunity and the caution needed as the index moves through what could be a highly dynamic growth phase.
Technical Analyst: Malik Awais
More By This Author:
Elliott Wave Technical Analysis: Ethereum Crypto Price News For Tuesday, May 13
Unlocking ASX Trading Success: Car Group Limited - Monday, May 12
Elliott Wave Technical Analysis: Mastercard Inc. - Monday, May 12


Comments
Log in or sign up to join the conversation.