
Indian Stocks Adani Ports & SEZ
ADANI PORTS & SEZ Elliott Wave Analysis – TradingLounge Day Chart
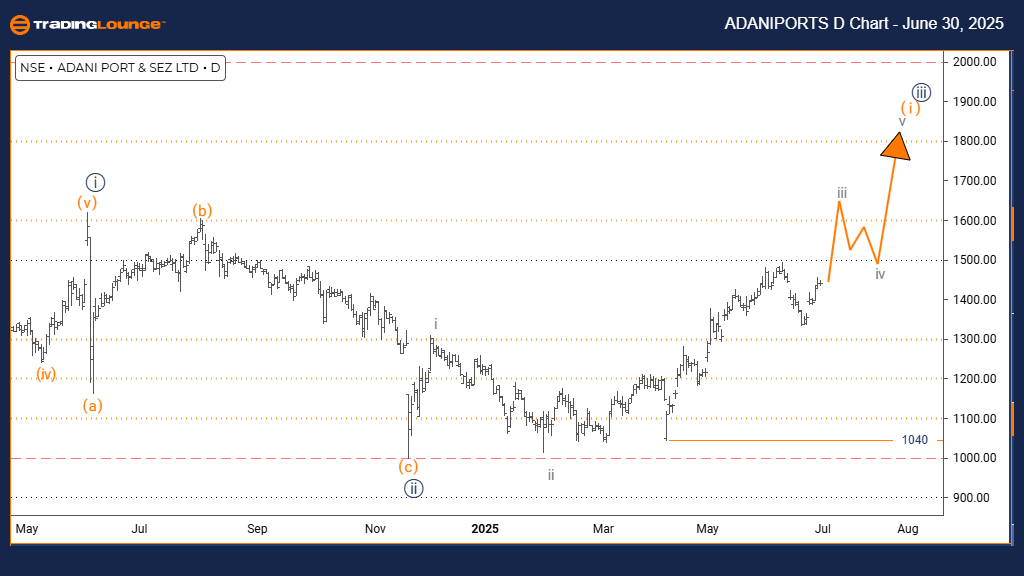
Technical Overview – Elliott Wave Analysis
FUNCTION: Bullish Trend
MODE: Impulsive
STRUCTURE: Orange wave 1
POSITION: Navy blue wave 3
DIRECTION (Next Lower Degree): Orange wave 2
DETAILS: Navy blue wave 2 seems completed; now, orange wave 1 of 3 is active.
Invalidation Level: 1040
The ADANI PORTS & SEZ daily chart shows a bullish trend. The market is in impulsive mode, suggesting strong upward movement. The structure is identified as orange wave 1, part of navy blue wave 3. This position indicates the stock is in the early stages of a larger upward trend.
The chart analysis suggests navy blue wave 2 has ended, initiating orange wave 1 of navy blue wave 3. This change points to the start of a strong upward move. The next expected wave at a lower degree is orange wave 2, likely a corrective dip following orange wave 1, before the uptrend resumes.
The key level to watch is 1040. If the price falls below this, the current Elliott Wave count becomes invalid, and the bullish view will need reassessment. Unless this happens, the wave pattern suggests continued price increases.
The setup indicates ADANI PORTS & SEZ may continue rising as part of navy blue wave 3, with orange wave 1 underway. The end of navy blue wave 2 confirms the bullish trend. The impulsive structure reflects strong buying and a high potential for further gains in the short term.
ADANI PORTS & SEZ Elliott Wave Analysis – TradingLounge Weekly Chart
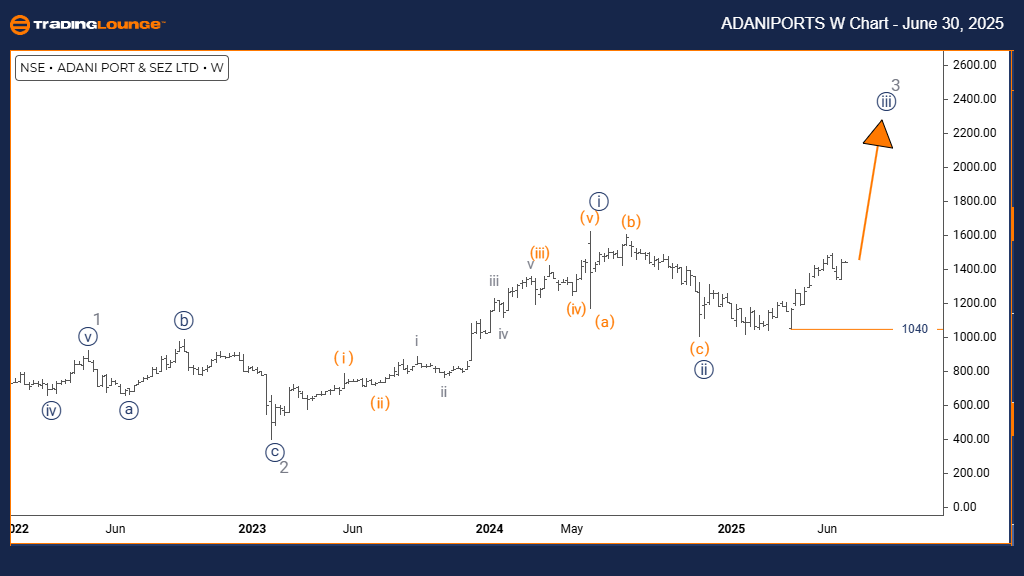
Technical Overview – Elliott Wave Analysis
FUNCTION: Bullish Trend
MODE: Impulsive
STRUCTURE: Navy blue wave 3
POSITION: Gray wave 3
DIRECTION (Next Lower Degree): Navy blue wave 4
DETAILS: Navy blue wave 2 seems completed; navy blue wave 3 is now active.
Invalidation Level: 1040
The ADANI PORTS & SEZ weekly chart indicates a bullish trend. The current price action is impulsive, confirming strong upward momentum. The wave structure is identified as navy blue wave 3, which is part of a broader gray wave 3. This positioning suggests the stock is in the strongest phase of its bullish cycle, where third waves usually see the largest price advances.
The analysis points out that navy blue wave 2 has completed, leading into the powerful navy blue wave 3. This segment of the Elliott Wave pattern typically involves rapid price increases with few corrections. After the completion of navy blue wave 3, the next expected move is navy blue wave 4, which would likely be a corrective phase.
An important level to watch is 1040. If the price drops below this, the current wave interpretation would be invalid, requiring a reassessment. Until then, the existing structure supports continued bullish price movement.
This technical outlook positions ADANI PORTS & SEZ for significant gains as navy blue wave 3 progresses. The impulsive behavior shows strong institutional interest, supporting a sustained rise in the coming weeks as the gray wave 3 develops.
Technical Analyst: Malik Awais
More By This Author:
Elliott Wave Technical Forecast: Newmont Corporation - Friday, June 27
Elliott Wave Technical Analysis: U.S. Dollar/Japanese Yen - Friday, June 27
Indian Stocks: NTPC Limited
At TradingLounge™, we provide actionable Elliott Wave analysis across over 200 markets. Access live chat rooms, advanced AI & algorithmic charting tools, and curated trade ...
more

