
USDJPY Elliott Wave Analysis Trading Lounge
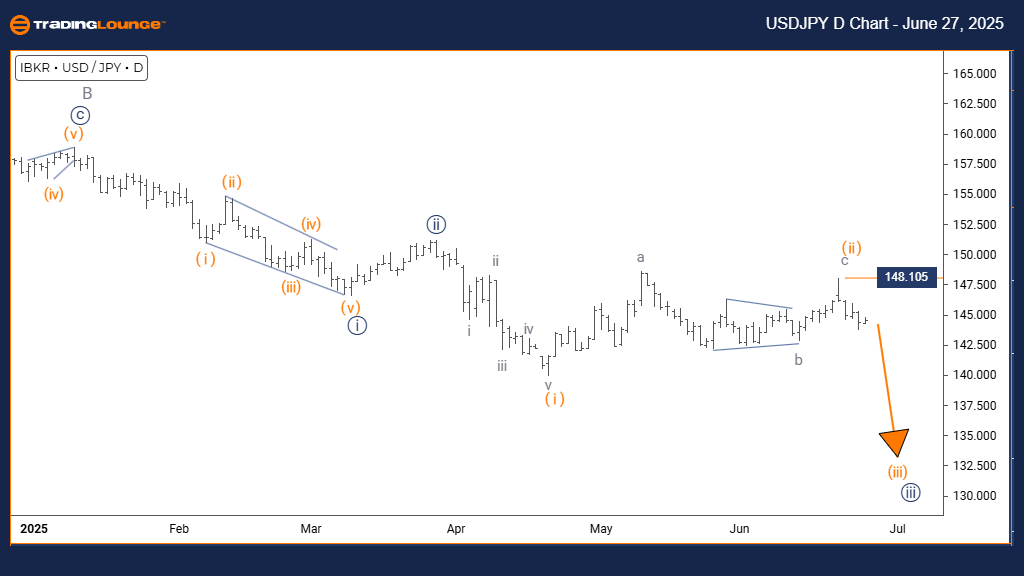
U.S. Dollar / Japanese Yen (USDJPY) Day Chart
USDJPY Elliott Wave Technical Analysis
FUNCTION: Bearish Trend
MODE: Impulsive
STRUCTURE: Orange Wave 3
POSITION: Navy Blue Wave 1
DIRECTION NEXT LOWER DEGREES: Orange Wave 3 (started)
DETAILS: Orange Wave 2 seems completed; now Orange Wave 3 is underway.
Wave Cancel Invalid Level: 148.105
The USDJPY daily chart analysis shows a bearish trend. Price is moving impulsively, pointing to strong downward momentum. The current wave in play is Orange Wave 3, part of the broader Navy Blue Wave 1 structure. This setup signals a powerful phase in the downtrend as third waves often show the most intense price drops.
Orange Wave 2 appears to have ended, shifting focus to Orange Wave 3. This is typically the strongest section in a bearish Elliott Wave pattern, where price can fall significantly with little retracement. The next internal development continues within Orange Wave 3.
A key level to watch is 148.105. If the price moves above this, the wave count becomes invalid and will need review. As long as price stays below, the pattern suggests continued downside.
Current technical indicators show USDJPY is likely to see sharper declines as Orange Wave 3 progresses. The impulsive wave formation reflects strong institutional selling and sets the stage for continued bearish movement within Navy Blue Wave 1.
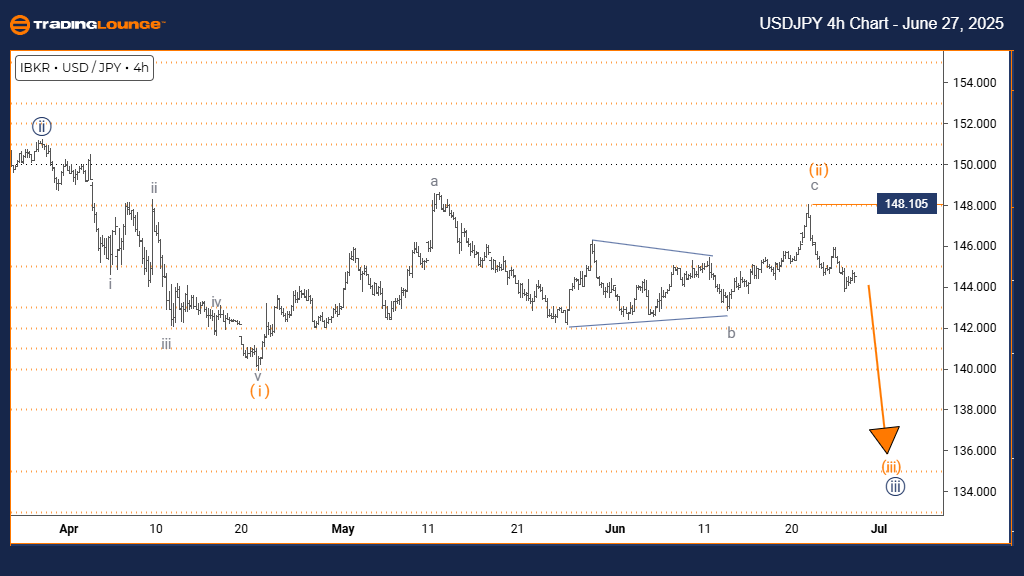
U.S. Dollar / Japanese Yen (USDJPY) 4 Hour Chart
USDJPY Elliott Wave Technical Analysis
FUNCTION: Bearish Trend
MODE: Impulsive
STRUCTURE: Orange Wave 3
POSITION: Navy Blue Wave 1
DIRECTION NEXT LOWER DEGREES: Orange Wave 3 (started)
DETAILS: Orange Wave 2 seems completed; Orange Wave 3 has started.
Wave Cancel Invalid Level: 148.105
The 4-hour Elliott Wave analysis for USDJPY continues to point to a bearish market. The price is in an impulsive phase within Orange Wave 3, which is part of a larger Navy Blue Wave 1 structure. This implies strong downward movement is in progress.
Orange Wave 2 has likely ended, and the transition into Orange Wave 3 has started. As a core part of the Elliott Wave model, Wave 3 often brings steep price declines. Traders should monitor this development for signs of trend continuation.
The invalidation level remains at 148.105. Any move above this point will invalidate the bearish scenario and require reassessment. Until then, the bearish outlook remains active.
The setup suggests strong selling pressure continues. As Orange Wave 3 unfolds, traders may see more downside momentum over upcoming sessions.
Technical Analyst: Malik Awais
More By This Author:
Elliott Wave Technical Forecast: Newmont Corporation - Friday, June 27
Indian Stocks: NTPC Limited
Elliott Wave Technical Analysis: Ethereum Crypto Price News For Friday, June 27


Comments
Log in or sign up to join the conversation.