
Indian Stocks: Adani Ports & SEZ
ADANI PORTS & SEZ – Elliott Wave Analysis | Trading Lounge Day Chart
ADANI PORTS & SEZ – Elliott Wave Technical Analysis
FUNCTION: Bullish Trend
MODE: Impulsive
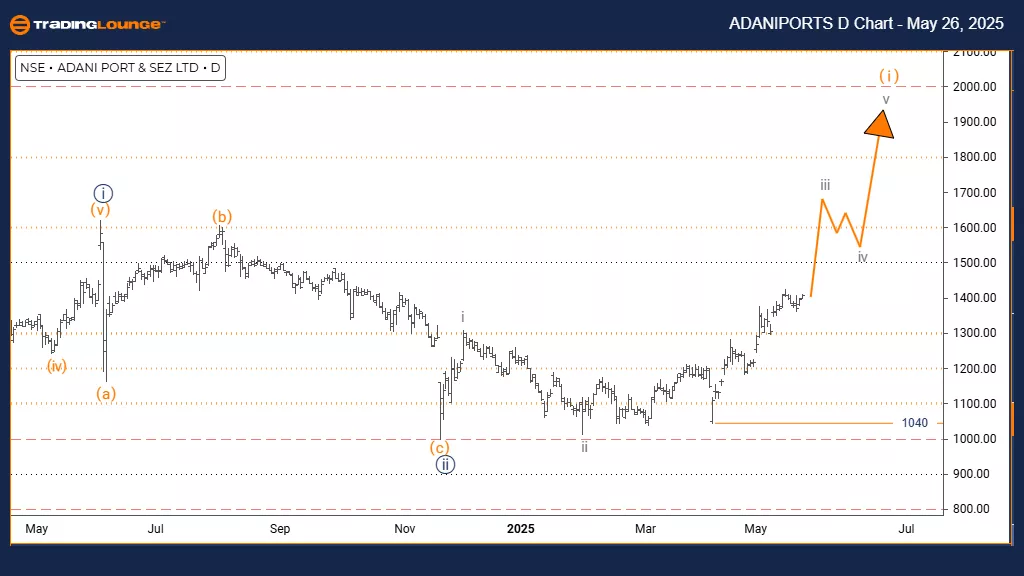
STRUCTURE: Gray Wave 3
POSITION: Orange Wave 1
DIRECTION NEXT LOWER DEGREES: Gray Wave 4
DETAILS: Gray Wave 2 appears completed. Gray Wave 3 of 1 is now unfolding.
Invalidation Level: 1040
The daily chart of Adani Ports & SEZ reveals a strong bullish trend, with impulsive movement taking place within a broader uptrend. The current wave count identifies Gray Wave 3 forming inside Orange Wave 1, confirming the end of Gray Wave 2’s corrective phase and initiating the most dynamic part of an Elliott Wave sequence.
This transition into Gray Wave 3 indicates significant buying momentum. Positioned within Orange Wave 1, this phase typically signals extended upward potential. The invalidation level is placed at 1040 — a critical price point where a breach would nullify the current wave structure and possibly lead to a more complex correction.
This technical framework offers traders and investors meaningful insights into the stock’s current trend. With further upside likely, the next key development will be Gray Wave 4 — a corrective pullback expected after the current impulsive rise. Traders should monitor continuation signals closely and manage risk appropriately as the bullish trend progresses.
ADANI PORTS & SEZ – Elliott Wave Analysis | Trading Lounge Weekly Chart
ADANI PORTS & SEZ – Elliott Wave Technical Analysis
FUNCTION: Bullish Trend
MODE: Impulsive
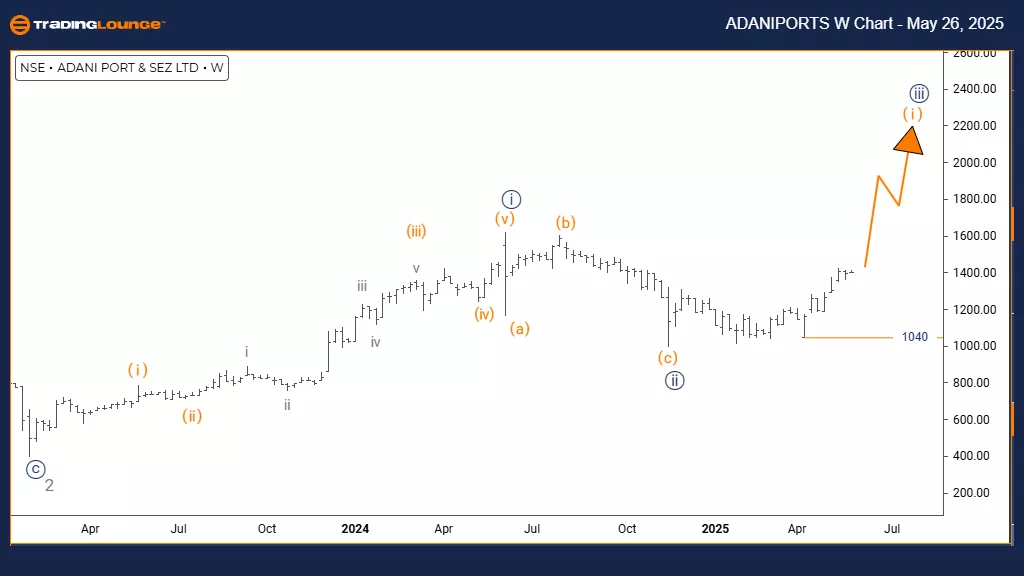
STRUCTURE: Orange Wave 1
POSITION: Navy Blue Wave 3
DIRECTION NEXT LOWER DEGREES: Orange Wave 2
DETAILS: Navy Blue Wave 2 appears completed. Orange Wave 1 of 3 is now in play.
Invalidation Level: 1040
The weekly chart paints a bullish long-term picture for Adani Ports & SEZ. The stock is now developing Orange Wave 1 within a broader structure defined as Navy Blue Wave 3. The completion of Navy Blue Wave 2 marks the transition into a fresh impulsive wave, suggesting strong potential for sustained growth.
The impulsive nature of Orange Wave 1 reflects robust institutional interest. As this wave unfolds, it marks the initial leg of Navy Blue Wave 3 — often the most powerful part of a bullish trend. The invalidation level at 1040 remains a key reference; any break below it could challenge the current wave interpretation.
Investors should see this phase as the beginning of an extended uptrend, with Orange Wave 2 — a corrective move — expected to follow. The analysis underscores the strength and potential longevity of this bullish setup, especially for those positioned in India’s infrastructure sector.
Technical Analyst: Malik Awais
More By This Author:
Unlocking ASX Trading Success: Insurance Australia Group Limited - Friday, May 23
Elliott Wave Technical Analysis: The Procter & Gamble Co. - Friday, May 23
Elliott Wave Technical Analysis: Euro/U.S. Dollar - Friday, May 23
At TradingLounge™, we provide actionable Elliott Wave analysis across over 200 markets. Access live chat rooms, advanced AI & algorithmic charting tools, and curated trade ...
more

