
PG Elliott Wave Analysis | Trading Lounge Daily Chart |
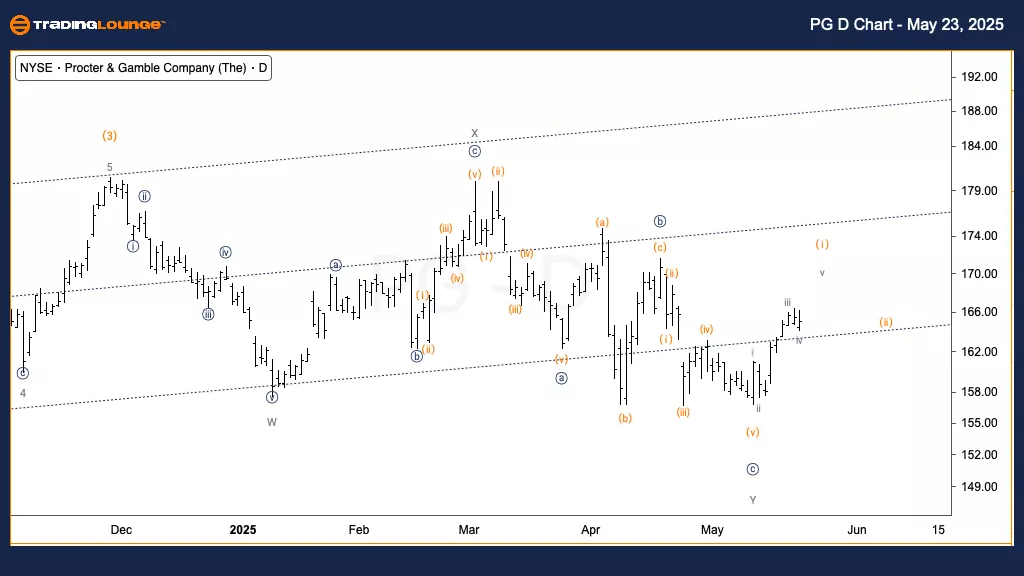
The Procter & Gamble Co. (PG) – Daily Chart
PG Elliott Wave Technical Analysis
Function: Trend
Mode: Impulsive
Structure: Motive
Position: Wave (i) of {i}
Direction: Upward in wave (i)
Details:
Procter & Gamble has found reliable support above the Medium Level at $150, indicating the beginning of a move higher. The current Elliott Wave analysis places the stock in wave (i) of {i}, with a likely advance toward the Minor Group 2 resistance, which begins at $165.
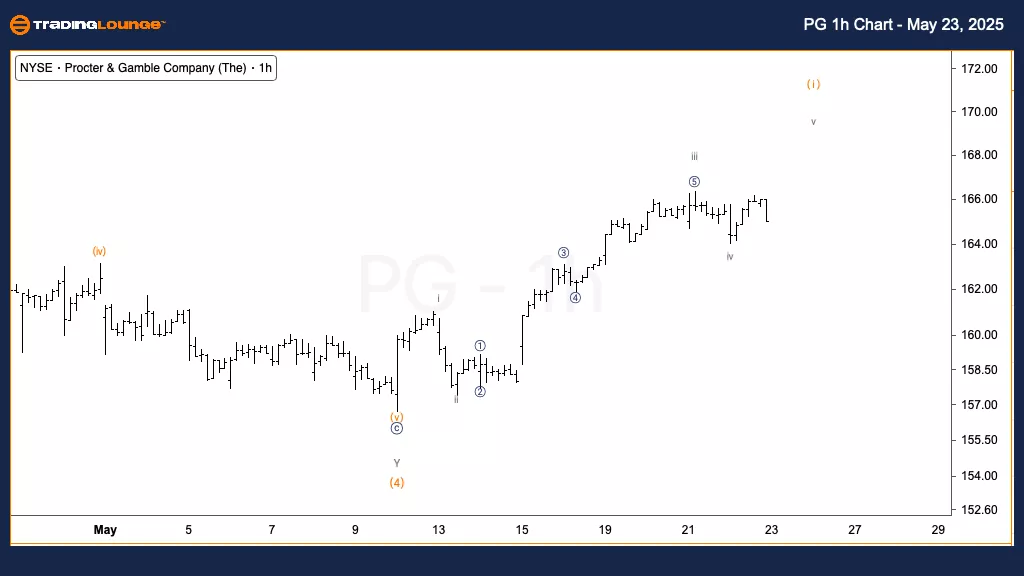
The Procter & Gamble Co. (PG) – 1-Hour Chart
PG Elliott Wave Technical Analysis
Function: Trend
Mode: Impulsive
Structure: Motive
Position: Wave iv of (i)
Direction: Upward into wave v
Details:
In the short term, PG appears to be forming a bottom in wave iv. If this level holds, it would suggest the start of wave v of (i), potentially forming a bullish setup near the $165 mark. A decisive move above this level would strengthen the bullish case.
Overview
This technical assessment uses Elliott Wave principles to track Procter & Gamble’s momentum on both daily and hourly intervals. Analysts expect upward continuation, particularly if price action sustains above key resistance zones.
Technical Analyst: Alessio Barretta
More By This Author:
Unlocking ASX Trading Success: Insurance Australia Group Limited - Friday, May 23
Elliott Wave Technical Analysis: Euro/U.S. Dollar - Friday, May 23
Elliott Wave Technical Analysis: Bovespa Index - Friday, May 23


Comments
Log in or sign up to join the conversation.