

Image Source: Pexels
Did you know that European stocks are easier to profitably trade than North American ones?
That seems counterintuitive, doesn’t it? Information about them seems hard to find. Most stock-oriented websites don’t cover them: European stocks are only listed if they have ADR tickers, and frequently there’s nothing written about them. Many brokers don’t offer them. Not only that, but you have to convert currency, take stamp taxes into account, and keep track of different hours for different exchanges.
So what’s easier about European stocks?
Picking the winners.
Part One: Why It’s Hard to Pick Winners in the US
Perhaps, like me, you believe that stock-picking can be rewarding. But stock-picking has gotten a bad rap lately because the US market is so well-trawled. It often seems that arbitrage opportunities no longer exist and that if a stock seems seriously underpriced, there’s usually a very good reason for that.
Back in 2011, Portfolio123, a website devoted to helping investors create profitable trading strategies primarily based on fundamental data, created a series of ranking systems based on five categories of factors: growth, momentum, quality, sentiment, and value. Eight years later, three of the analysts at Portfolio123—Marc Gerstein, Riccardo Tambara, and myself—revised those ranking systems to a small degree, added one more category—low volatility—and combined them to create what we called the Core Combination ranking system. This ranking system was by no means optimized through extensive backtesting. It was meant as a starting point for investors and contained all the usual factors—nothing esoteric or recherché. For example, the growth system was simply EPS growth, sales growth, and operating income growth, with 1/3 weight each; each of those was broken down into basic growth and acceleration, and those were then subdivided by time period. The low volatility ranking system was half beta and half price volatility, with each of those given 1-year, 3-year, and 5-year lookback periods.
Unfortunately, this system was really too simple to work very well on large US stocks. If you bought the top 50 stocks out of the S&P 500 every four weeks over the last ten years, your performance would be no better than the S&P 500 index (I’m using 0.25% slippage). The same is true for the S&P 1500, the Russell 1000, the Russell 2000, and the Russell 3000.
You could, of course, create a better ranking system through extensive research and backtesting, including a lot of more esoteric factors like share turnover, net operating assets to total assets, and accruals; adding size factors to the mix, and modifying a number of other measures. That’s what I’ve done for my own personal ranking systems, and I’ve made a lot of money using them on North American stocks. But it hasn’t been easy. I’ve been spending tons of time tweaking my systems and placing trades on low-liquidity stocks.
Part Two: Why It’s Easy to Pick Winners in Europe
So what happens when we use the Core Combination to pick the top 50 stocks in Europe?
First, let’s exclude a few countries. Turkey, Romania, and Hungary all rank high on corruption indexes. And forget about Russia (which isn’t even included as part of Europe in Portfolio123’s coverage).
Next, let’s start with only the 500 largest companies like we did in the US. And this time I’ll use higher slippage—0.5% per trade—to compensate for currency exchange, commissions, and stamp taxes. The results are poor. But if you expand your universe to the top 1000 companies, you’ll get an excess return over the MSCI Europe index of 3% per annum. The top 1500 companies? 6.5% per annum. The top 3000 companies? 13.5% per annum.
Here’s a more visual example. Here is the performance of the Core Combination system on the 3000 largest public companies in the US and Canada, in 20 “buckets,” over the last ten years, with monthly rebalancing. If you bought the stocks ranked 95 to 100 you would get 15.5%; if you bought the stocks ranked 0 to 5 you would lose 2.7%.
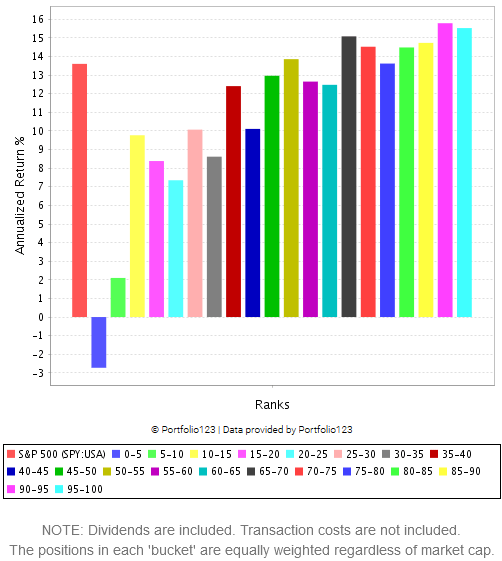
Historical performance by ranks, Core Combination on Russell 3000
Now here is that same ranking system’s performance on the top 3000 European stocks. The top 5% make an astonishing 25.5% annually.
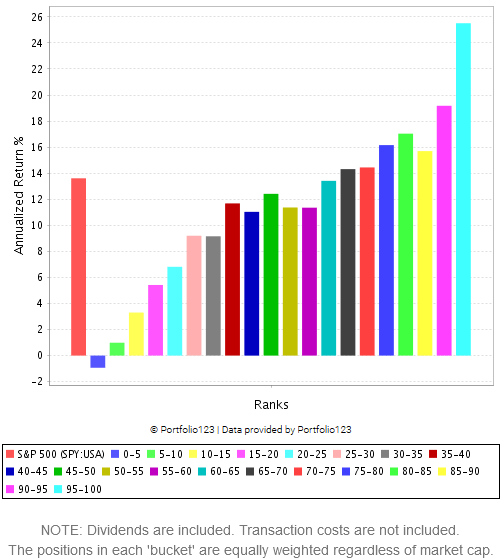
Historical performance by ranks, Core Combination on Euro 3000
What makes this better is that these results are truly out of sample. When we designed the core combination system, we relied to some degree on our experience backtesting US stocks. We didn’t actually backtest the ranking system very much—we didn’t want to overoptimize—but most of the factors had been backtested individually. On the other hand, we did absolutely no testing on European stocks, for which we only added the data recently. This is an entirely new dataset that we’d never tested at all.
So you can see that it’s a lot easier to pick winning stocks in Europe. You can use all the factors that seem to have been arbitraged away in the US to create winning ranking systems and screens.
Part Three: Trading Costs
Trading costs are not to be taken lightly. Currency conversion fees will range from 0.02% to a whopping 1%, depending on your broker and your currency. Commissions can be significantly larger than those for US stocks. Stamp taxes can be expensive: the UK charges 0.5% for all stock purchases, France charges 0.3%, Spain 0.2%, Italy 0.1%, and Ireland beats them all, charging 1% (note that these taxes are only charged when you purchase a stock, not when you sell it). There are some stocks and some exchanges that are difficult or impossible to trade from the US. And while some brokers allow European trades in retirement accounts, others don’t, and one (Fidelity) makes you place them over the phone.
Part Four: Some European Stocks to Buy
I currently hold shares in 18 European companies. My largest holdings are in EdiliziAcrobatica (EDAC: ITA), a Genoese construction company; Arctic Paper (ATC: POL), a Polish paper manufacturer; Anglo-Eastern Plantations (AEP: GBR), a British company that owns rubber and palm oil plantations in Indonesia and Malaysia; Torpol (TOR: POL), a Polish railway infrastructure construction company; and Western Bulk Chartering (WEST: NOR), a Norwegian shipping company. (I take Peter Lynch’s dictum to heart: the more boring a company sounds, the better investment it’s likely to be.) But I’m sure you can find plenty of other gems if you look hard enough.
Or maybe not even that hard.
My CAGR since 1/1/2016: 47%.
My top ten holdings right now: JILL, HMDPF, JAKK, DLHC, CWCO, HSON, SIRE, JOB, GNE, SUMXF.
More By This Author:
The Cost Of Equity: Rethinking The Conventional Wisdom, Part 2
The Cost of Equity: Rethinking the Conventional Wisdom, Part 1
Why the Riskiest Stocks Have Been Vastly Outperforming Safe Ones


Comments
Log in or sign up to join the conversation.