EUR/USD At Potential Support That May Lead To A Rally
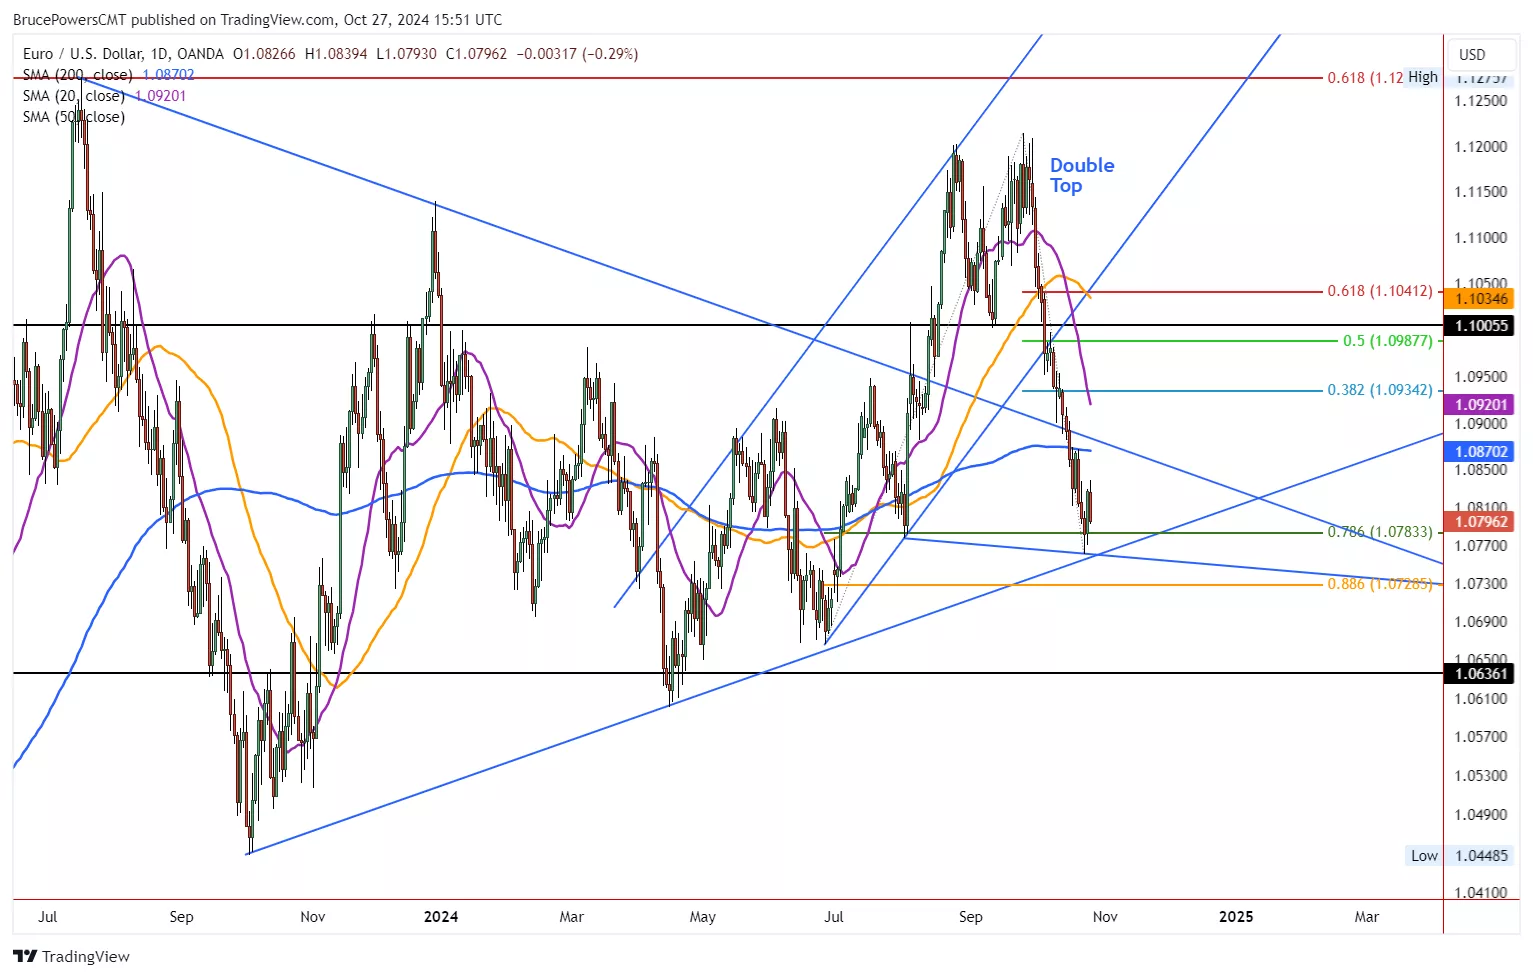
The EUR/USD found a low last Wednesday at 1.0761, right around an uptrend line that is the bottom of a large symmetrical triangle pattern. It led to a one-day bullish reversal on Thursday, followed by a pullback Friday. However, the recent retracement also found support around the 78.6% retracement zone. Together, the above indications point to the potential for a counter-trend rally. Also, notice the potential double bottom pattern in the relative strength index momentum oscillator (RSI).

If a rally gets moving then the 20-Day MA, now at 1.0920, along with the 38.2% Fibonacci retracement at 1.0934 are initial upside targets. Further, on the way up the 200-Day MA at 1.0870 needs to be exceeded and it may present enough resistance to stall or reverse the rally. Higher potential targets include the 50% retracement at 1.0988 and the neckline from a double top at 1.1005. Notice that the EUR/USD fell back into the triangle formation last wee and that a breakout above the 200-day line will be close to triggering a second bull breakout of the triangle. Subsequently, the second triangle breakout follows through to the upside eventually or the triangle evolves into a different pattern.
More By This Author:
Bearish Shooting Star Shines
Has Bitcoin Reached A Temporary Top?
Explosive Move In Bitcoin Could Be Close At Hand
Disclosure: Above analysis is for educational purposes only. Proceed at your own risk. All information given here is largely based on technical analysis and the analysis is very dynamic in nature and ...
more


