Has Bitcoin Reached A Temporary Top?
Image Source: Unsplash
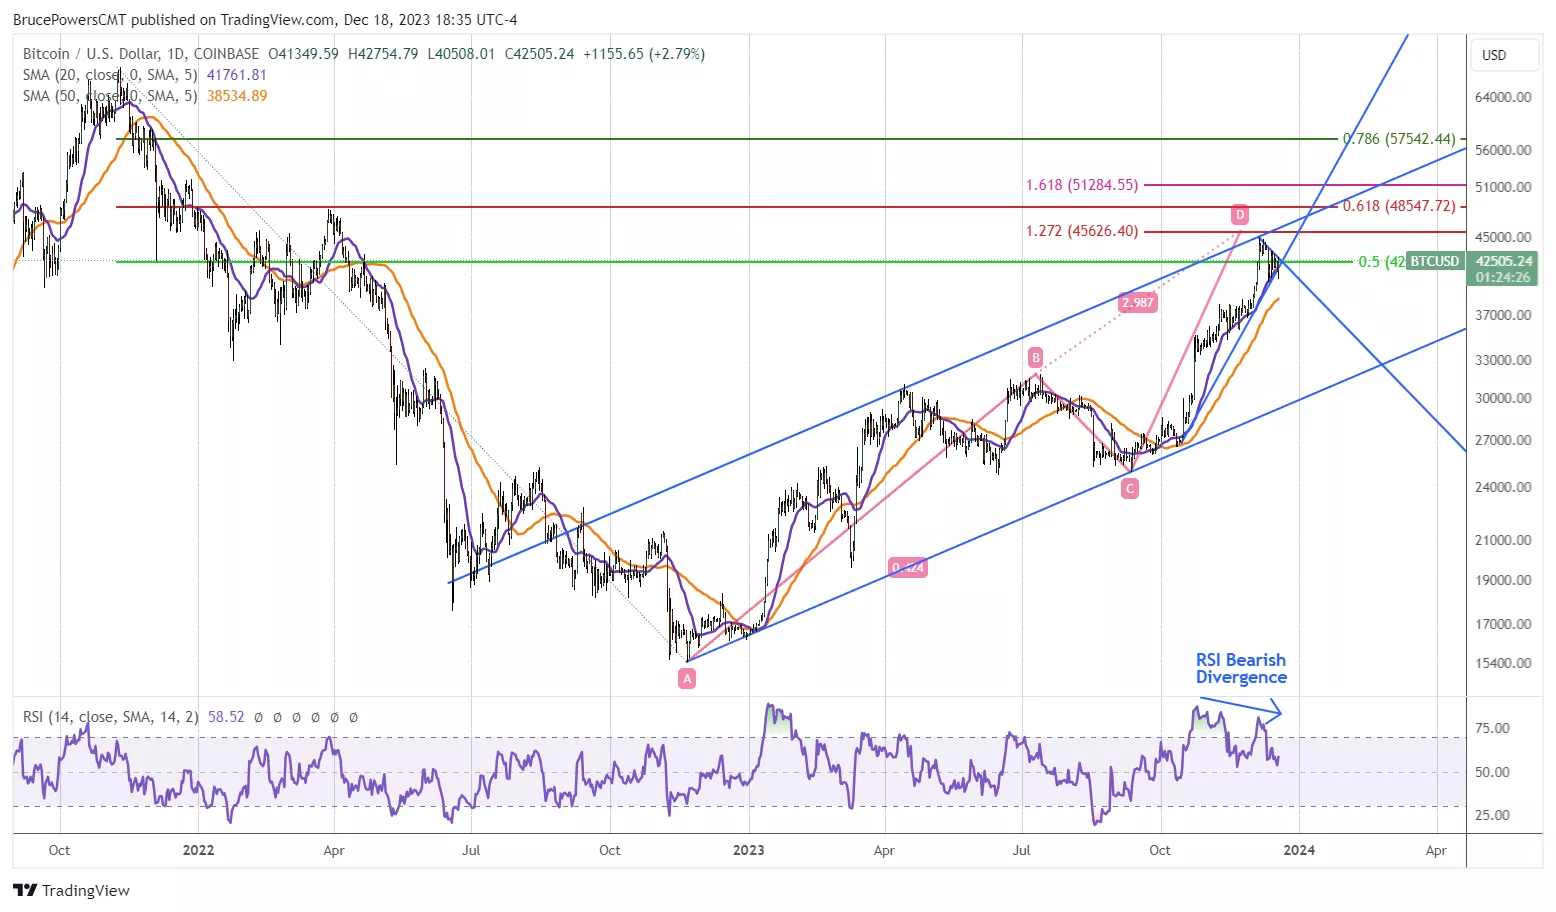
Bitcoin (BTC/USD) has seen strong performance in 2023, rising as much as 28,470 points or 172% as of December 18. At the recent trend high of 45,000 bitcoin was up by 20,100 or 81% from the September 11 swing low (C) of 24,900, and 29,540 or 191% from the November 2022 low of 15,460. The initial leg up off the 2022 low (AB) ended with an advance of 106% in July 2023 (B).
(Click on image to enlarge)

Extended ABCD Target Reached at Recent High
These swings help define a rising extended ABCD pattern that reached a possible completion at the recent trend high. Once complete, either a correction may follow (so far, a very mild correction has begun), or the pivot high is exceeded triggering a bull trend continuation. A classic target for the ABCD pattern occurs when the price appreciation is similar in both the AB and CD legs of the pattern or are close. An extended pattern derives the completion of the CD leg by multiplying the price appreciation in the first leg by the Fibonacci ratio of 127.2% or 161.8%. In this case the 127.2% extension was reached, or close enough.
Bullish or Bearish?
There is an argument for both scenarios, a bullish continuation or correction first. Since October 16 bitcoin has been rising with dynamic support represented by the rising 20-Day MA (purple). A new test of support at the 20-day line occurred today and price was rejected to the upside. This behavior is short-term bullish and shows the near-term uptrend intact. It also opens the door for a continuation higher. Bullish signals first occur on a rise above 43,442, and then the recent trend high of 45,000. A daily close above 45,000 will be needed to confirm strength.
Possible Signs of a Temporary Top
However, there are clues pointing to a possible temporary top. The first is the completion of the ABCD pattern as noted above. Also, the 50% retracement area has shows resistance and the relative strength index (RSI) has been showing a bearish divergence for the past 46 days. Also, resistance seen at the trend high matches the top trend channel line, which is where signs of resistance would be expected. Nevertheless, a drop below the recent swing low of 40,150 would be needed for a bearish signal.
More By This Author:
Explosive Move In Bitcoin Could Be Close At Hand
Ethereum Falling On The Heels Of Bitcoin
Bitcoin Continues Its Downward Trajectory
Disclosure: Above analysis is for educational purposes only. Proceed at your own risk. All information given here is largely based on technical analysis and the analysis is very dynamic in nature and ...
more


