EUR/GBP Price Analysis: Dives Amid Recession Fears, Post-BoE Hike
The EUR/GBP dropped for the second straight day following Thursday’s Bank of England (BoE) monetary policy decision to raise rates by 50 basis points (bps) which bolstered the Pound Sterling (GBP) against the Euro (EUR). In addition, a deceleration in business activity in the Eurozone (EU) and the UK increased recession fears. Still, upbeat retail sales in the UK exacerbated a leg-down in the EUR/GBP. At the time of writing, the EUR/GBP exchanges hands at 0.8566 after hitting a high of 0.8607.
EUR/GBP Price Analysis: Technical outlook
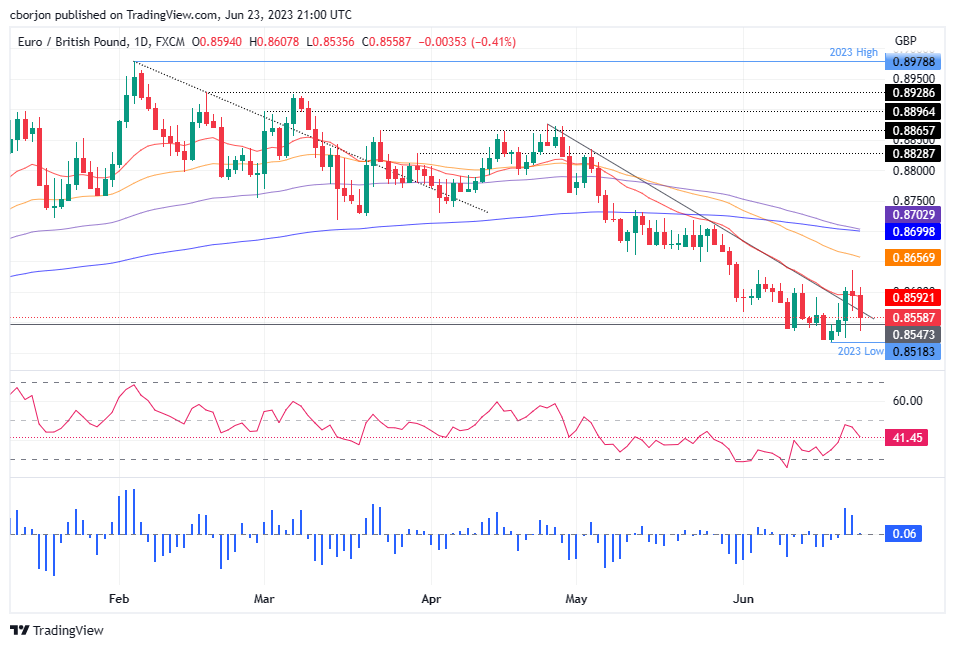
Given the fundamental backdrop, the EUR/GBP is set to extend its downtrend. Also, the pair crossed below the 20-day Exponential Moving Average (EMA) at 0.8593, a bearish signal that exacerbated the cross fall toward daily lows reached at around 0.8535 before stabilizing at current exchange rates.
Sellers will need the EUR/GBP printing a daily close below the June 22 daily low of 0.8569 to cement the downtrend. That would put at risk support levels like the current two-day low of 0.8535, followed by the weekly low of 0.85255, before challenging the year-to-date (YTD) low of 0.8518.
Otherwise, EUR/GBP buyers would remain hopeful of cracking the 0.8600 figure, though firstly, they need to conquer the 20-day EMA. Upside risks above the 0.86 figure lie at a June 22 high of 0.8639, with buyers eyeing the 50-day EMA as the next ceiling level at 0.8657.
EUR/GBP Price Action – Daily chart
(Click on image to enlarge)
EUR/GBP
| OVERVIEW | |
|---|---|
| Today last price | 0.8566 |
| Today Daily Change | -0.0028 |
| Today Daily Change % | -0.33 |
| Today daily open | 0.8594 |
| TRENDS | |
|---|---|
| Daily SMA20 | 0.8592 |
| Daily SMA50 | 0.8691 |
| Daily SMA100 | 0.8759 |
| Daily SMA200 | 0.8751 |
| LEVELS | |
|---|---|
| Previous Daily High | 0.8636 |
| Previous Daily Low | 0.8574 |
| Previous Weekly High | 0.8613 |
| Previous Weekly Low | 0.8522 |
| Previous Monthly High | 0.8835 |
| Previous Monthly Low | 0.8583 |
| Daily Fibonacci 38.2% | 0.8598 |
| Daily Fibonacci 61.8% | 0.8612 |
| Daily Pivot Point S1 | 0.8567 |
| Daily Pivot Point S2 | 0.8539 |
| Daily Pivot Point S3 | 0.8504 |
| Daily Pivot Point R1 | 0.8629 |
| Daily Pivot Point R2 | 0.8664 |
| Daily Pivot Point R3 | 0.8692 |
More By This Author:
Silver Price Analysis: XAG/USD Struggles To Reclaim Ground, And Turns Bearish Below The 200-dma
WTI Price Analysis: Prints A Fresh Nine-Day Low At $67.60 As Global Recession Fears Deepen
GBP/USD Looks Vulnerable Above 1.2700 Despite Fed-BoE Policy Divergence Narrows
Disclaimer: Information on these pages contains forward-looking statements that involve risks and uncertainties. Markets and instruments profiled on this page are for informational purposes only ...
more


