
- Silver price sees a minor gain of 0.50% but fails to reclaim the May 26 daily low, resulting in a bearish outlook.
- The technical analysis shows support at the March 21 daily low of $22.14; breaking this could see a drop below the $22.00 figure.
- Potential resistance lies at the May 26 low-turned resistance at $22.68, with the 200-day EMA at $22.94 and $23.00 as the next challenges.
Silver price remains firm in the session but could not reclaim the May 26 daily low; previous support turned resistance and also below the 200-day Exponential Moving Average (EMA). Therefore, the XAG/USD turned bearish from a technical perspective. The XAG/USD is trading at $22.32, a gain of 0.50%.
XAG/USD Price Analysis: Technical outlook
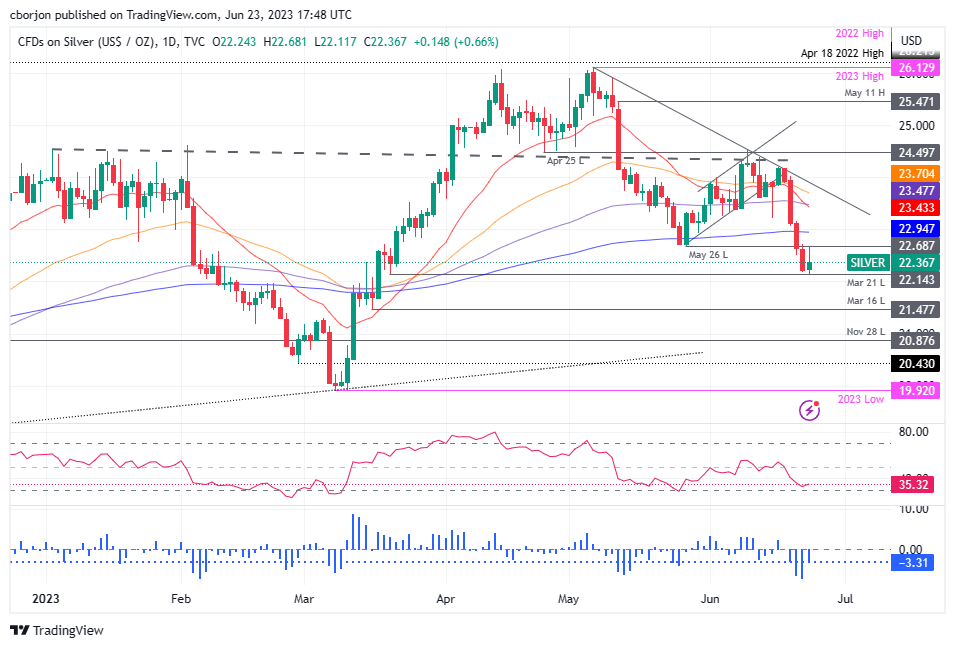
Silver is downward biased but must break support at the March 21 daily low of $22.14 on its way toward dropping below the $22.00 figure. Even though the XAG/USD fell to a new three-month high, cheered by sellers, the XAG/USD could remain trading sideways, within the $22.10/$22.69 area without a catalyst.
If XAG/USD slumps below $22.00, the next support will lie at the March 16 low of $21.46 before exposing the $21.00 figure and the November 28 daily low at $20.87. On the flip side, the XAG/USD stays above $22.00. The next resistance would be the May 26 low-turned resistance at $22.68, followed by the 200-day EMA at $22.94 ahead of challenging $23.00.
From an oscillator point of view, the Relative Strength Index (RSI) shows signs of bearishness, while the three-day Rate of Change (RoC) portrays sellers losing some momentum but remaining in charge.
XAG/USD Price Action – Daily chart
(Click on image to enlarge)
XAG/USD
| OVERVIEW | |
|---|---|
| Today last price | 22.39 |
| Today Daily Change | 0.14 |
| Today Daily Change % | 0.63 |
| Today daily open | 22.25 |
| TRENDS | |
|---|---|
| Daily SMA20 | 23.58 |
| Daily SMA50 | 24.25 |
| Daily SMA100 | 23.33 |
| Daily SMA200 | 22.47 |
| LEVELS | |
|---|---|
| Previous Daily High | 22.74 |
| Previous Daily Low | 22.18 |
| Previous Weekly High | 24.4 |
| Previous Weekly Low | 23.22 |
| Previous Monthly High | 26.14 |
| Previous Monthly Low | 22.68 |
| Daily Fibonacci 38.2% | 22.39 |
| Daily Fibonacci 61.8% | 22.52 |
| Daily Pivot Point S1 | 22.04 |
| Daily Pivot Point S2 | 21.83 |
| Daily Pivot Point S3 | 21.49 |
| Daily Pivot Point R1 | 22.6 |
| Daily Pivot Point R2 | 22.94 |
| Daily Pivot Point R3 | 23.15 |
More By This Author:
WTI Price Analysis: Prints A Fresh Nine-Day Low At $67.60 As Global Recession Fears Deepen
GBP/USD Looks Vulnerable Above 1.2700 Despite Fed-BoE Policy Divergence Narrows
WTI Plummets Due To Global Rate Hike Fears, Worldwide Economic Slowdowns Woes


Comments
Log in or sign up to join the conversation.